ANALYSIS OF PREVIOUS TRENDS AND EXISTING STATE OF RESEARCH AND DEVELOPMENT IN THE CZECH REPUBLIC AND A COMPARISON WITH THE SITUATION ABROAD
Prepared by a working group consisting of:
Doc. RNDr. Zdeněk Kukal, DrSc. (Research and Development Council of the Government of the Czech Republic), RNDr. Marek Blažka (Research and Development Council of the Government of the Czech Republic), Ing. František Hronek, CSc. (Ministry of Education, Youth and Sport of the Czech Republic)
and
Ing. Boris Dlouhý, CSc. (Confederation of Industry of the Czech Republic), Ing. Josef Dvornák (Industrial Property Office), Col. Ing. Karel Eminger (Ministry of Defence), Mgr. Helena Glatzová (Czech Bureau of Statistics), RNDr. Petr Harmanec, DrSc. (Academy of Sciences of the Czech Republic), Prof. MVDr. Karel Hruška, CSc. (Grant Agency of the Czech Republic), Ing. Ludvík Jurkech (Ministry of Environment), Mgr. Martin Mácha (Ministry of Labour and Welfare), Prof. JUDr. Karel Malý, DrSc. (Czech Rectors' Conference), Ing. Jan Mokrý (Ministry of Industry and Trade), Ing. Karel Mráček, CSc. (Association of Research Organisa-tions), Ing. Vít Ondrůšek (Ministry of Finance), MUDr. Miroslav Palát (Ministry of Health), Prof. MUDr. Jaroslav Pokorný, DrSc. (Council of Czech Universities), Ing. Ladislav Rudolf (Ministry of Culture). |
Prague, May 1999
© Ministry of Education, Youth and Sport
and Research and Development Council of the Government of the Czech Republic
CONTENTS
SUMMARY
When comparing the state of research and development in the Czech Republic and abroad six years ago and today, we see that the former has remained essentially the same. Elsewhere, research and development is a highly preferred and stabilised area. Negative changes, if any, seldom have a significant impact and at any rate are compensated in subsequent years. In some countries such as Finland, Ireland, Denmark, etc., positive trends clearly prevail in research and development.
The Czech Republic considerably lags behind developed countries in a number of research and development indicators. In recent years, the difference in some indicators has deepened still more owing to permanently stagnating expenditures allocated to research and development. The situation is especially detrimental in the private sector where the already low figures have experienced further reduction.
All transforming countries of Central and Eastern Europe face similar problems. The most rapid transformation of research and development took place in the new German states, but also there the incurred costs were considerable and the process was anything but painless. Studies undertaken abroad rank the Czech Republic among countries characterised by an active approach to new conditions for research and development, together with Hungary, Poland, and Estonia. Other countries fall into the other, "passive" group, characterised in a foreign study as "waiting for better times to come".
Positive results of those organisations and professionals that are able to make use of the new conditions slowly begin to win the day in the Czech Republic, too. The new potential comprises primarily free choice of topics, free discussion, cooperation with foreign institutions, grants, publishing in foreign periodicals, and convertibility of the Czech currency. Information available on the Internet offers competent researchers access to previously unthinkable knowledge contained in databases of results, electronic publications, etc. Easy accessibility of study programmes of universities, research programmes, information provided by national and international grant agencies, and access to Internet conferences bring about additional possibilities.
One may state quite generally that the input in research and development stagnates (proportion of financing in the GDP, numbers of persons involved; there is a critical shortage of researchers, especially young ones). Both the output and its quality grow at a moderate pace (publications, citations, patents, foreign trade in high-tech products, etc.).
The Czech Republic is classified world-wide among the fifty richer and more effective countries. Various international institutions, bodies and fora rank the Czech Republic 35th to 45th worldwide according to criteria like the level of national economy, competitiveness, credibility, and other indicators. This analysis presents a number of examples indicating that in research and development the position of the Czech Republic is a little higher.
Comments on Individual Chapters of the Analysis
Analysis of OECD research and development statistics
Data taken from local and foreign sources have been compared by means of standard statistical procedures. The assessed characteristics include expenditures on research and development, their structure and the structure of their utilisation. Taking a passive approach expenditures allocated to research and development in the Czech Republic may be considered to be in line with the economic level of the country as measured by the gross domestic product per head; in fact they correspond neither to the potential nor to the needs of the country. The Czech Republic has so far failed to put across the strategy adopted by developed countries like Ireland and Finland, to a certain extent Austria, or Israel and South Korea outside Europe. These countries, together with extensive restructuring of their national economies raise their expenditures on research and development.
Step by step the Czech Republic has succeeded in reducing the difference in the structure of utilisation of funds allocated to research and development in comparison with other OECD countries. As a result of rapidly growing expenditures in the university sector, the disproportion between the university and the state administration sectors diminishes. Such expenditures may however grow only in concert with their potential utilisation. The painful fact persists that the proportion of funds allocated to research and development in the private sector continues to dwindle owing to declining private resources.
Compared with the EU member states the Czech Republic devotes lower means to research and development and, accordingly, exhibits lower number of persons involved in that sector.
Analysis of state expenditures devoted to research and development in the Czech Republic
Reported data on state expenditures are more accurate than general statistical data and enable one to analyse in more detail some aspects of financing research and development from the state budget. Differences between data of financial authorities and statisticians exist everywhere but are considerably more pronounced in the Czech Republic. The reasons are attributable to the accounting units as well as to the entities responsible for data processing.
State expenditures allocated to research and development in the Czech Republic expressed as a proportion of GDP decreased until 1995 and then started a slow climb. The objective of 0.7 % of GDP, which the government undertook to achieve already in 1994, continued to be postponed. Specific terms were set forth for the first time in the Government Resolution No. 249 of 22 March 1999, which stated that the above level is to be attained in 2002.
The analysis devotes considerable attention to institutional and targeted financing. In OECD countries with a stable system of state subsidies granted to research and development institutional financing plays a decisive role especially in the area of basic research. In the Czech Republic objective and independent procedures of assessment of research topics (projects) were at first introduced into targeted financing, a fact that created favourable conditions for its rapid development. Institutional financing was based on the last year budget of the relevant institution, modified by an index common to many organisations. This category of R&D financing therefore stagnated. The ratio of targeted to institutional financing grew until 1998. The volume of targeted funds exceeded that distributed institutionally. The "Rules Governing Assessment of Research Plans and Results of Organisations" effective as of the beginning of 1999, are desirable means to increase the proportion of institutional financing.
Financing defence-related research was ridden by deficiencies consisting in that expenditures were included in the 1998 budget of the Ministry of Defence - and subsequently outlaid - that did not have the character of research and development. Entities that spend most funds allocated to research and development include the Academy of Sciences of the Czech Republic, the Czech Grant Agency, and the Ministry of Industry and Trade. The share of other sectors is smaller.
Analysis of state-supported research and development projects (CEP)
Each principal investigator of a project eligible for a subsidy from the state budget must submit to the Research and Development Council of the Government of the Czech Republic, through the relevant state administration authority, fundamental information about the project in a comprehensive electronic form.
The Council administers the corresponding database - Central Evidence of Projects (CEP). The database is an extensive and valuable source of information, and was used to analyse the scientific orientation, the number, size and duration of projects, the size of individual programmes, methods of financing, and some other factors.
In comparison with other countries smaller projects (characterised by lower costs) and with shorter realisation period (mostly three years) prevail in the Czech Republic. The Czech Republic also exhibits a relatively high number of small programmes with low number of projects. The majority of targeted funds are allocated for technical sciences.
Bibliometric analysis of R&D results
Bibliometric analysis was performed for the first time in connection with a material for the Czech government; although it is commonplace in official foreign documents, in the Czech Republic it has been so far considered doubtful or downright deprecated. The discussion that took place during preparation of this material might contribute to appreciation of bibliometry as an important tool especially valuable in assessing basic research.
In publications and citations the Czech Republic lags behind developed countries (such as, e.g., USA, France, and Great Britain) and especially behind countries that have traditionally stressed quality of scientific papers (Switzerland, the Netherlands, Belgium, Denmark and the Nordic states). When however derived indicators are used (like bibliometric productivity) that respect the lower level of expenditures devoted to research and development and the lower numbers of investigators, the Czech Republic approaches the average level of the EU. Most other bibliometric indicators of the Czech Republic are similar to those of Hungary, Poland, Slovenia and the less developed EU countries.
With regard to quality of published papers as measured by the citation index, the situation is less satisfactory. The citation index determined for papers originating in the Czech Republic reaches about one half that of papers published in the EU member states. It is however gratifying that the response continues to rise, in particular during the period of existence of the independent Czech state, as shown in Figure D7a.
Analysis of patents1 considered as output of research and development
A part of research and development must focus on obtaining results applicable to new products, technologies and services. Owners of such information secure their priority inter alia through patent applications to ensure benefits ensuing from a dominant position on the relevant market or from granted licences.
Since 1995 the number of patents filed by subjects resident in the territory of the Czech Republic has stagnated at a level markedly lower than the EU average. The Czech Republic also lags behind in dynamically developing scientific disciplines, posing high demands on research and development, and maintains a level approximately the same as Hungary and Poland.
The Czech Republic significantly lags behind EU countries also in the number of applications filed abroad. Possible reasons might be the following: an assumed lack of interest on the part of foreign competitors, poor chance of selling a licence, or insufficient funds necessary for patent protection abroad.
Analysis of the output of applied research and development projects
The European Union and Europe as a whole have for many years lagged behind the USA and Japan with regard to the speed and effectiveness of utilisation of R&D results, despite comparable level of research and development.
In order to gain objective insight into the situation prevailing in the Czech Republic an analysis was performed with focus on utilisation of results of state-subsidised applied R&D projects incorporated in programmes co-ordinated by the Ministry of Industry and Trade, the Ministry of Defence, the Ministry of Agriculture, and the Ministry of Environment. Information has been collected about nearly 900 projects completed between 1994 and 1997. The analysis dealt with differences between the projected and actually achieved results and the underlying reasons. Analysis of the data surprisingly show an exceptionally high rate of success (sometimes in excess of 90 %), hardly ever achieved in the USA and Japan, still less so in the EU; at the same time the level and scope of activities supporting transfer of R&D results to industrial practice are considerably lower in the Czech Republic.
The reason of this paradox apparently lies in low demands imposed on goals. Targets of R&D projects are more demanding and more risky abroad. Another reason involves vagueness of objectives and methodological deficiencies in assessment of results. This problem will be dealt with in other work devoted to preparation of national research and development policies.
Economic performance and R&D
This part is devoted to an analysis of indicators only indirectly connected with research and development. Many activities such as construction, management, marketing, services provided to distributors and customers are interposed between research and development. Investigator involved in research and development and their organisations may influence only a small part of these activities. Those who finance research and development, i.e., the state and especially individual enterprises, must tackle them. It is obvious that top-quality research and development lies at the foundations of good economic results, high competitiveness, low unemployment and prosperity.
There is no theoretical justification indicating whether support extended to research and development is the reason for or consequence of economic growth. The success of dynamically developing countries (Ireland, Finland, Israel, etc.) proves that increased support extended to research and development must either precede or at least accompany economic restructuring.
The analysis described in this part compares the level of GDP in the Czech Republic and the rate of its growth with some selected OECD countries and some transforming countries that also strive to accede to the EU. The level of GDP and labour productivity in the Czech Republic only slightly exceed 60 % of the EU average, but are still higher than in Hungary, Poland, and other Central and East European countries. The loss of dynamics in the Czech economic growth is however alarming.
The balance of foreign trade in high-tech products exhibits a relatively favourable trend despite the fact that imports still outpace exports.
The concluding part presents examples of expenditures allocated to research and development in major, global firms. Their production programmes and the level of their products are relatively well known in the Czech Republic. The examples show unequivocally that the level of expenditures is in line with both the demanding character of the manufacturing sectors, sophistication of the products, and the added value. Increasing expenditures devoted to research and development alone, without restructuring the industrial sectors, does not guarantee prosperity.
Introductory
Pursuant to Government Resolution No. 811/1998 of 9 December 1998  , an analysis of the trends and the prevailing situation in research and development in the Czech Republic and abroad ("Analysis") is prerequisite for preparing the National Research and Development Policy of the Czech Republic
  .
.
A similar analysis, "The Present State of Research and Development in the Czech Republic and Abroad  ", was prepared in 1996 and used in formulation of Principles of the Government of the Czech Republic for the Field of Research and Development" adopted in 1997 (Government Resolution No. 247 of 23 April 1997) and - in an abridged and updated form - also in the preparation of "Principles of Scientific Policies of the Czech Republic for the Turn of the Century", approved by the Czech government in 1998 (Resolution No. 397 of 10 June 1998
  ).
).
The analysis is based on objective data characterising the state of research and development in the Czech Republic and in developed countries. It comprises Figures and Tables2 with accompanying comments that interpret the presented data and summarise the main reasons for differences and changes. In agreement with the requirements underlying Decision No. 811  adopted by the Government seven areas were analysed, of which three refer to inputs and four to outputs.
The primary sources of data characterising input to research and development mostly agree with those used in previous analyses, and include primarily statistics of OECD countries, items of the state budget of the Czech Republic referring to research and development, and analyses of research and development projects financed from the state budget (CEP). In contrast to previous analyses the chapter dealing with outputs of research and development is substantially broader here. Preceding materials analysed only some selected indicators concerning patent applications. This time the number of indicators covering inventions has been extended substantially and bibliometric output (scientific papers and the corresponding citations) have been analysed for the first time together with utilisation of results of applied research and development projects completed between 1994 and 1997 as well as the interconnection between economic level and research and development.
A novel procedure was also employed to compile the submitted material. While the 1996 analysis was prepared by a narrow group of experts from the Research and Development Council of the Czech Republic and the Ministry of Education, Youth and Sport, this time the working group included experts from the Czech Academy of Sciences, universities, a number of national state administration authorities, the Czech Bureau of Statistics, the Industrial Property Office, the Czech Grant Agency, the Confederation of Industry of the Czech Republic, the Association of Research Organisations, etc. This enabled the scope of analysed sources to be extended substantially.
Main areas covered by the analysis:
- Analysis of OECD statistical data referring to research and development.
- Analysis of expenditures allocated to research and development in the state budget of the Czech Republic.
- Analysis of research and development projects subsidised by the state (CEP).
- Bibliometric analysis of the research and development results.
- Analysis of patents as research and development output.
- Analysis of results of applied research and development projects.
- Relationship between economic performance and research and development.
Parts A, D, E, F, and G contain additional methodological comments and explanations.
A. ANALYSIS OF OECD STATISTICS RELATED TO R&D
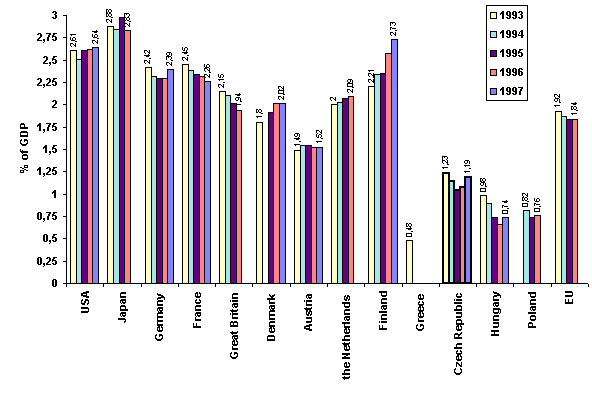
A1. Trend of Total R&D Expenditures
(total expenditures on research and development as per cent of GDP)
|
Source: |
OECD - Main Science and Technology Indicators 1998/2. |
| Note: |
Numbers in the Figure indicate the proportion in GDP of total expenditure on research and development respectively in the first and last year of the period in ques-tion. Incomplete columns for some countries indicate missing data. |
Commentary
- Developed countries spend 2 to 3 per cent of GDP on R&D, primarily to preserve their competitive edge, while some less developed OECD countries less than 1 %. Sweden, not included in the above selection (see A15), devotes the largest proportion of GDP to R&D (3.6 %), The macroeconomic relationship between total R&D expenditures and GDP has a microeconomic analogy. Statistically more significant still is the correlation between expenditures of individual firms on R&D and their revenues/earnings. Expenditures of firms on R&D are analysed in detail in Chapter G: Economic Performance and R&D.
- The slump in total R&D expenditures experienced by France and Great Britain was mostly due to reduced demand for armaments after the end of the cold war. Disposable funds allocated to R&D in Germany decreased primarily because of massive subsidies granted to the new states, and currently are on the rise.
- In contrast to the Czech Republic, indirect support extended to R&D (tax reliefs etc.) plays an important role in EU countries.
- In 1989 expenditures devoted to R&D in the now defunct Czechoslovakia slumped (in 1991 expenditures adjusted for the Czech Republic alone amounted to 2.03 % of GDP). The decline continued in the Czech Republic at a somewhat more moderate pace till 1995 when expenditures devoted to R&D started to rise. Hungary experienced a similar decline. This sharply contrasts with the rise in Finland, from a considerably higher initial base at that, which accompanied a deliberate and rapid transformation of the economy, strongly dependent on the Soviet market similarly as the Czech Republic and Hungary. Denmark and Ireland, not shown in the graph, also exhibited a rising trend (see A15).
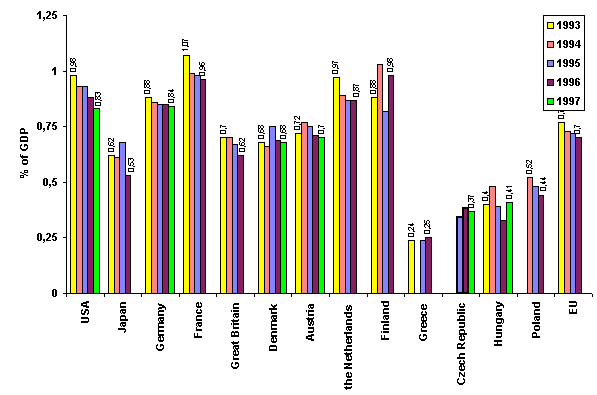
A2. Trend of state expenditures on R&D
(state expenditures on research and development in per cent of GDP)
| Source: |
OECD - Main Science and Technology Indicators 1998/2. |
| Note: |
Mean state expenditures on R&D in the EU according to other OECD data (OECD in Figures 1996 - 1998, Table R&D II) amount to 0.82 % of GDP.
Only federal expenditures are listed in case of Austria; similarly, only federal expenditures are shown for the USA and investment costs are excluded; expenditures on social sciences are excluded in case of Japan. Incomplete data for some countries indicate lack of data. |
Commentary
- The generally observed decline of state participation in R&D financing experienced in the first half of the 1990s has already levelled off and in some countries has been replaced by a growth.
- Among the listed countries, only Greece has devoted to R&D a smaller proportion of the state budget than the Czech Republic. In Greece (and also in Portugal - not shown - for which a number of data items for recent years are lacking) state expenditures on R&D are distinctly smaller than what one would expect on the basis of the level of their economies, and the two countries have been reprimanded.
- Chapter B which analyses state expenditures on R&D in the Czech Republic contains data higher than the figures shown in this Chapter A. Minor differences (say 5 to 10 %) between data presented by statistical and financial authorities are not uncommon also in developed countries. In the Czech Republic the difference is however much higher - amounting to almost 25 % of state expenditures - and, what is more worrying still, tends to increase. The reason, in addition to poor discipline of organisations filling in statistical questionnaires, is probably insufficient capacity of departments that deal with R&D in the Czech Bureau of Statistics.
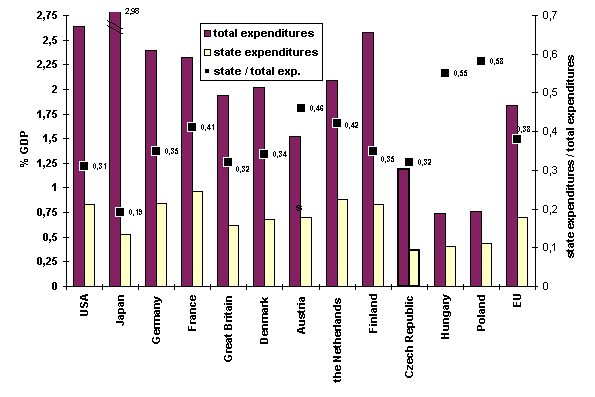
A3. Comparison of total and state expenditures on R&D - 1997 data
(total and state expenditure expressed as % of GDP and their trend, and the ratio state/total expenditures)
| Source: |
OECD - Main Science and Technology Indicators 1998/2. |
| Note: |
Data for 1997 are shown for the USA, Germany, Denmark, Austria, the Czech Republic, and Hungary, 1996 data are shown for the remaining countries (1995 data for Finland) |
Commentary
- The proportion of total and state expenditures of the Czech Republic and the EU is similar (in contrast to Poland and Hungary) and shows a proportion of state R&D financing identical to that of the USA. An increase in state expenditures devoted to R&D must be accompanied with increasing expenditures from other sources, primarily from individual businesses.
- Japan is a case of interest among developed countries as it exhibits a low level of state support devoted to R&D, compensated by substantially higher expenditures of the private sector. The USA show a high but gradually decreasing level of federal support allocated to R&D (obviously owing to high proportion of defence- and space-related R&D).
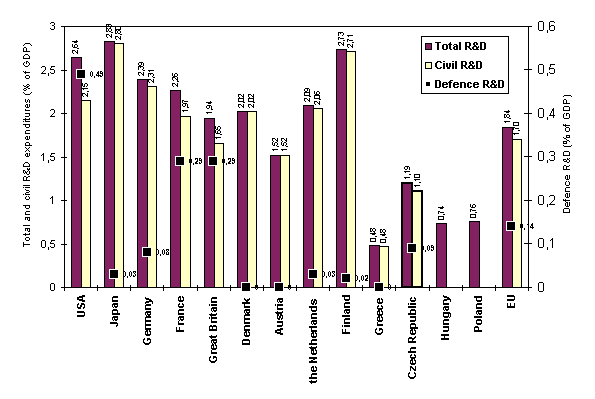
A4. Expenditures on civil R&D - 1997 data
(total expenditures and expenditures on civil research and development as per cent of GDP)
| Source: |
OECD - Main Science and Technology Indicators 1998/2 |
| Note: |
The data shown for Japan, Great Britain, the Netherlands and Poland are from 1996; the data for Greece are from 1993; the source does not list data referring separately to defence and civil R&D for Poland and Hungary. |
Commentary
- The difference between total and civil expenditures represents expenditures allocated to defence-related research and development.
- A substantial part of R&D expenditures is devoted to defence research and development only by the nuclear superpowers (among the listed countries these include the USA, Great Britain and France) where they amount to more than 10 % of the total R&D expenditures. This ensues not only from direct costs incurred in connection with development of new weapons but also from support extended to some areas of basic and applied research related to defence research and development.
- The remaining countries devote less than 5 % of total R&D expenditures to defence research and development. A number of countries have no or essentially no defence industry and, accordingly, their R&D bears almost exclusively civil character (Austria, Denmark, Greece, and Finland).
A5. Resources of total R&D financing - 1997 data
(resources of total R&D expenditures in per cent)
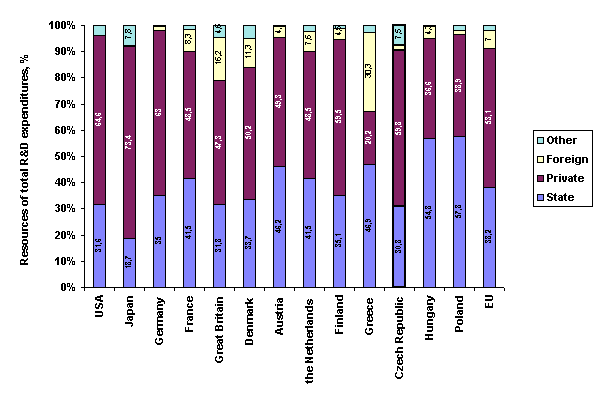
| Source: |
OECD - Main Science and Technology Indicators 1998/2 |
| Note: |
Data for 1997 are incomplete (refer to USA, Germany, Austria, the Czech Republic and Hungary; data for the remaining countries are from 1996 (1995 for Finland and 1993 for Greece). |
Commentary
- In OECD countries the state budget contributes almost 40 % to total R&D expenditures; the smallest value is reported from Japan characterised by a large proportion of industrial giants and low level of GDP redistribution via the state budget. The Czech Republic also shows a relatively low proportion of the state contribution in total R&D expenditures.
- There is a high proportion of foreign resources in Great Britain, the Netherlands, and Denmark (and in Ireland, not shown in the Figure) owing to investments by US and Japanese firms. The high foreign contributions in Greece (and in Por-tugal - not shown) stem from the EU budget. The two countries have been cen-sured for excessively exploiting the EU budget and asked to contribute more to R&D themselves. Also the low level of R&D expenditures (including state ones) in countries of Central and Eastern Europe is the subject of criticism.
- The proportion of other resources (donations, private funds, etc.) is very low bar in Japan. The figure stated in the above source for the Czech Republic (7.5 %) is dubious and subject to examination.
A6. Use of R&D funds - 1997 data
(classification of total R&D expenditures by sector, in per cent)
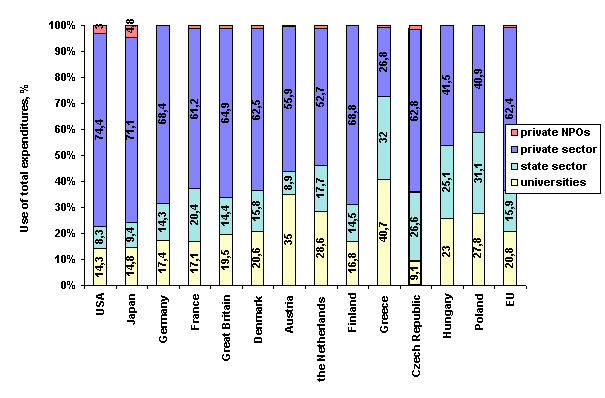
| Source: |
OECD - Main Science and Technology Indicators 1998/2 |
| Note: |
In OECD the state sector comprises also organisations financed primarily from the state budget, including public-sector institutions (except universities). NPOs (non-profit organisations) are private, not-for-profit legal entities. Last data available cover 1993 for Austria and Greece, 1996 for Japan, Great Britain, the Netherlands, Poland and the EU. |
Commentary
- In the most developed economies more than 60 % of total R&D expenditures are targeted to private-sector research and development. This still applies to the Czech Republic although a steady decline has been apparent. The very low proportion of privately financed R&D in Greece is due to the structure of the in-dustry where sectors characterised by low demand on R&D prevail.
- In the Czech Republic the proportion of total R&D expenditures devoted to universities is the lowest among all countries examined, but has started to grow rapidly in recent years (see A8). There is a distinct difference between the G7 and small countries. In the former universities use less than 20 % owing to the effect of enterprises represented by industrial giants, often globally oriented. In smaller countries universities use some 25 % of total expenditures; Greece shows a higher proportion still as the private sector is less significant there and R&D is concentrated in the universities. A high proportion of funds allocated for the universities is also apparent in countries with a long tradition of university research such as Austria.
- In the Czech Republic the state sector (comprising resort research institutions and the Academy of Sciences) has previously utilised a substantial part of funds devoted to R&D, but a continuing decline is already apparent and the Czech Republic now approaches the level of France. In Greece the state sector utilises a considerable part owing to the low proportion of private R&D.
- State expenditures in the Czech Republic are distributed via budgetary chapters of central state administration authorities as well as the chapters of the Academy of Sciences and the Czech Grant Agency.
A7. Trend of total R&D expenditures in the state sector
(trend of total R&D expenditures used in the state sector; per cent of GDP)
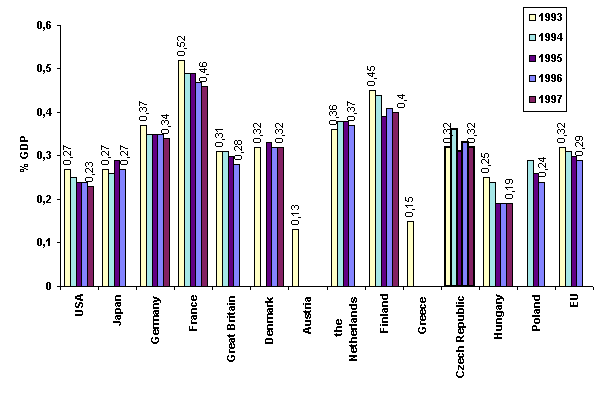
| Source: |
OECD - Main Science and Technology Indicators 1998/2 |
| Note: |
Incomplete columns for some countries indicate lack of data. |
Commentary
- In the EU the trend of R&D expenditures in the state sector (relative to GDP) exhibits a moderate decline (see the EU average). It then means that, as GDP grows in most of the examined countries, in actual terms the state financing stagnates.
- In the Czech Republic funds devoted to R&D in the state sector slumped starting in 1991 (0.62 % of GDP) to almost one half in 1995. The reason for this reduction was privatisation and dissolution of a number of resort research institutions (the Ministry of Industry and Trade now has no research institute of its own), in part also by the restriction of funds allocated to the Academy that took place in 1993.
- Among developed countries the state sector assumes an important position in France and Finland (in both instances with a declining trend). Funds devoted to the state sector in the USA and Japan are somewhat lower than in most EU countries.
- Owing to availability of only sporadic and mostly obsolete data for Austria and Greece, it is difficult to comment on the situation in the state R&D sector in these countries. The preceding Figure A6 however indicates that while the figure stated for Austria (0.13 % of GDP - Figure A7) is due to a low proportion of R&D expenditures in the state sector compared with other sectors, this is not the case for Greece where the low value (0.15 % of GDP) is caused by small total R&D expenditures (0.48 % of GDP in the relevant year).
A8. Trend in total expenditures allocated to university R&D
(trend in total expenditures devoted to university R&D in per cent of GDP)
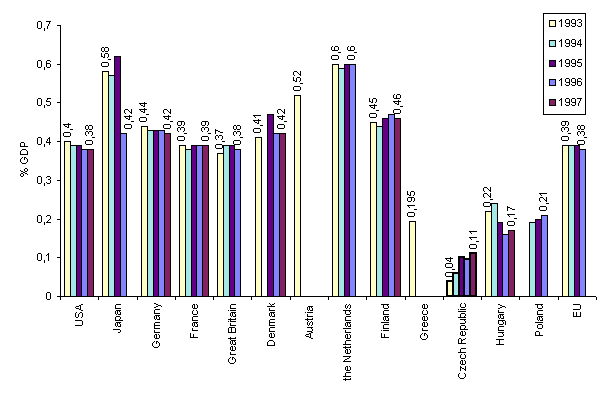
| Source: |
OECD - Main Science and Technology Indicators 1998/2 |
| Note: |
Incomplete columns for some countries indicate lack of data. |
Commentary
- R&D expenditures of universities are by far the lowest in the Czech Republic over the examined period not only in comparison with traditional OECD coun-tries but are also lower than in Hungary and Poland. The rate of growth of the indicator (together with the significant rise experienced in 1999 - see B2.4) however demonstrates the increasing importance of university R&D.
- One of the reasons underlying the difference between the Czech Republic and foreign countries is the fact that in the Czech Republic university R&D is financed almost exclusively from the state budget while the private sectors plays a more important role abroad.
- University R&D expenditures have stabilised in most countries. There is no explanation for the eye-catching recent development in Japan.
- The trend in Austria characterised by traditionally strong university research and development is not apparent from the above graph owing to lack of data.
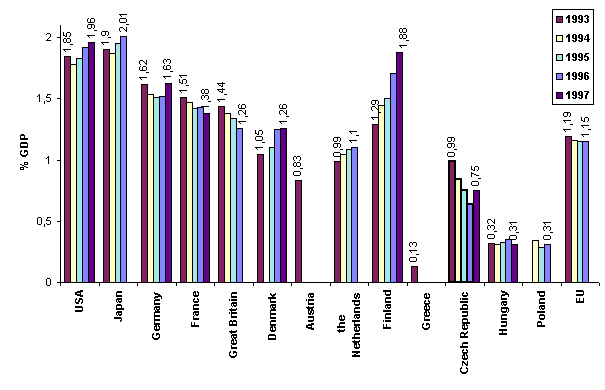
A9. Trend in total R&D expenditures in the private sector
(trend in total R&D expenditures in the private sector, % of GDP)
| Source: |
OECD - Main Science and Technology Indicators 1998/2 |
| Note: |
Incomplete columns for some countries indicate lack of data. |
Commentary
- The decrease in total R&D expenditures in the private sector (expressed as per cent of GDP in large European countries - France, Great Britain) was brought about, inter alia, by reduced demand for the defence industry products after the end of the cold war. In the US this trend has been arrested and a growth is already apparent.
- Expenditures devoted to private R&D in smaller European countries, in particular The Netherlands, Denmark, and Finland increased between 1993 and 1997 as participation of these countries in defence-related R&D was insignificant. To a certain extent this holds true also of Germany a Japan.
- A permanently decreasing trend of expenditures on private R&D in the 1990s, respectively their stagnation during the last two years, is typical of the situation in the Czech Republic. As a result we lag behind the EU and other developed countries with regard to expenditures on private R&D. This adverse trend is confirmed by the results of regular surveys conducted by the Confederation of Industry of the Czech Republic which confirm that large and medium-sized enterprises in the Czech Republic spend 1 to 2 % of their annual revenues on research and development. In the EU, private firms invest 4 to 10 % of their annual revenues in research and development depending on the sector involved (see G5). Moreover, private enterprises in the Czech Republic prefer short-term programmes and tasks expected to bring immediate return on capital. More fundamental and long-term research is not supported for a number of reasons that include practically non-existent indirect support extended to private research and development.
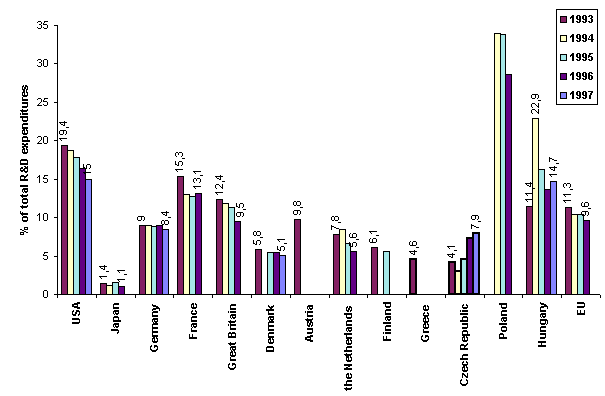
A10. Trend of state participation in financing private R&D
(state support extended to private R&D in per cent of overall R&D expenditures)
| Source: |
OECD - Main Science and Technology Indicators 1998/2 |
| Note: |
Incomplete columns for some countries indicate lack of data. |
Commentary
- The first years of economic transformation in the Czech Republic (1990 to 1992) were characterised by a rapidly declining participation of the state in private R&D financing. Starting in 1995, the support extended by the state has continued to rise (significantly in 1998 and 1999 as shown in Figure B4).
- Big countries, especially the US, France, Great Britain (but not Japan) co-finance private R&D to a substantial extent through defence contracts. Their decline is the reason for the distinctly decreasing trend of state co-financing of private R&D.
- A similar decline was not apparent in Germany where the trend of R&D expenditures was not influenced by any slump of the defence industry.
- The exceptionally high participation of the state in financing private R&D in Poland and Hungary is obviously due to involvement of the state in restructur-ing the industry, adequate innovation policies, and participation in efforts aimed at increasing the technological level of the industry. In recent years the state subsidies have however shown a distinctly decreasing trend.
A11. Trend of workforce involved in R&D
(number of persons employed in R&D adjusted for full-time employment (Full Time Equivalent, FTE) per one thousand inhabitants

| Source: |
OECD - Main Science and Technology Indicators 1998/2 |
| Note: |
Numbers are adjusted for full-time employment (FTE) according to the OECD meth-odology. Incomplete columns for some countries indicate lack of data. |
Commentary
- There is a positive correlation between the number of persons employed in R&D and the total R&D expenditures; it is especially significant between the headcount and expenditures stemming from private resources.
- Part-time employment in the R&D sector is relatively commonplace every-where, especially at the universities. Without the FTE adjustment the resulting work force would be about twice as high.
- In the Czech Republic the previous decrease in the absolute number of persons involved in R&D has been arrested. Without the FTE adjustment the number of persons involved in R&D per 10,000 employees would be 44 in 1995 and 45 in 1996.
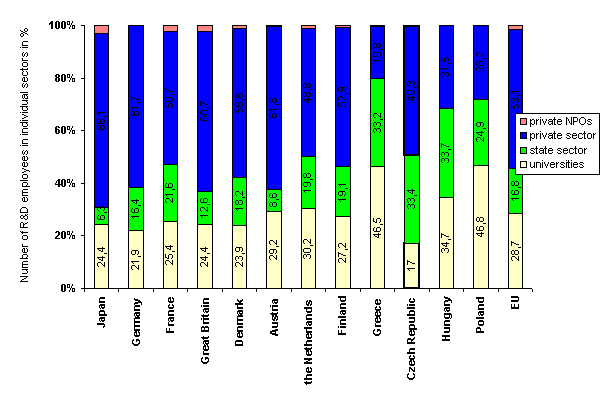
A12. Classification of R&D workforce by sector - 1997 data
(headcount of R&D FTE-adjusted employees in individual sectors in per cent)
| Source: |
OECD - Main Science and Technology Indicators 1998/2 |
| Note: |
"Private NPOs" represent the private non-profit sector. 1997 data refer to Denmark, the Czech Republic and Hungary, 1996 data to the remaining countries. Last available data for Great Britain, Austria and Greece are from 1993, for Germany and Finland from 1995; no data are available for the USA. |
Commentary
- The number of persons employed in R&D and the funds devoted to R&D in individual sectors are approximately in line. The number of university R&D employees is, with the exception of Austria, somewhat higher. It is an accepted fact that R&D is the cheapest at universities and most expensive in the private sector.
- The average value for the EU indicates that more than one half of persons employed in R&D work in the private sector; the corresponding figure is only one half as high in the Czech Republic. Despite the moderate decline in the total number of R&D employees the trend almost did not affect the private sector.
- In the Czech Republic the state sector involves resort research institutions and the Czech Academy of Sciences. Accordingly, the number of persons employed in state R&D is higher here than the EU average (16.8 % in the EU and 33.2 % in the Czech Republic in 1996).
A13. Total R&D expenditures per employee in R&D
(total R&D expenditures in USD per employee - FTE-adjusted - at purchasing power parity)

| Source: |
OECD - Main Science and Technology Indicators 1998/2 |
| Note: |
Incomplete columns for some countries indicate lack of data. PPP- Purchasing Power Parity |
Commentary
- R&D expenditures per employee are strongly affected by purchasing power parity of individual currencies.
- The adjusted R&D expenditures per employee correlate neither with the GDP nor with the R&D expenditures, nor finally with the structure of individual R&D sectors. Thus, in Austria the expenditures per R&D employee are the highest although the university R&D, generally considered the cheapest of all, is very strong in Austria.
- The level of wages in individual countries is very important, and so is - to a certain extent - the tradition in remunerating R&D employees relative to other professions.
- One may nevertheless state that in developed countries the R&D expenditures per employee are essentially the same; they are significantly lower in Hungary and Poland, while the Czech Republic gradually approaches the EU countries.
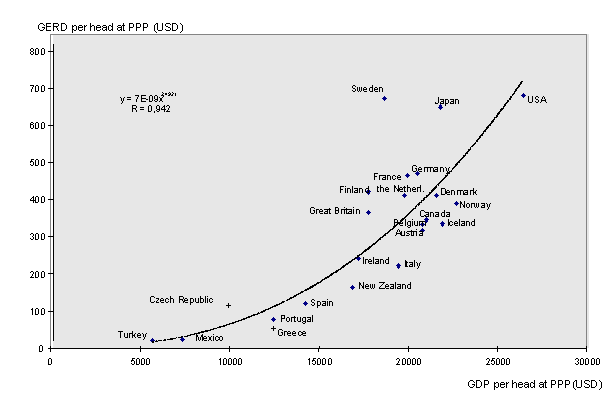
A14. Total R&D expenditures and GDP - 1997 data
(dependence of total R&D expenditures on GDP - both indicators at purchasing power parity per inhabitant)
| Source: |
OECD in Figures (statistics on the member states, 1998 Edition) |
| Note: |
GERD - total R&D expenditures |
Commentary
- Rich countries devote more funds to R&D not only in absolute terms (proportionally to the higher GDP per head) but also relatively (larger propor-tion of GDP per head), resulting in further GDP growth.
- It is generally true that economic progress is preceded by technical progress ensuing from innovations. An almost exclusive source of innovations is pro-gress based on utilising results of research. Accordingly, support extended to R&D is expected to lead to economic growth and the preceding graph may be interpreted accordingly. Attempts to determine in an exact manner the causality between R&D expenditures and the gross domestic product however meet with serious difficulties due to the extraordinary complexity of relationships between research and development and other activities like transfer of results of R&D to the private sector, the unavoidable capital construction, marketing, commercial and service activities, etc. The above graph can be therefore interpreted in the opposite manner - rich states may afford to invest more in R&D (and poor countries will benefit from the general progress without financing it). Thus, economics does not provide unequivocal interpretation of the graph.
- The situation in microeconomy is simpler. Firms that invest in R&D more extensively enjoy increasing growth of both revenues and earnings (nothing automatic in that, though - many prerequisites are involved, see G5). To sim-plify somewhat: should higher R&D expenditures initiate a growth of GDP in the Czech Republic, they must be accompanied (and perhaps preceded) with fundamental restructuring of enterprises.
A15. OECD Statistics - comparison of various countries
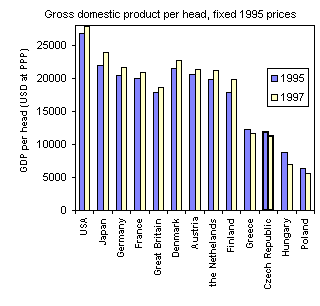 |
Quantitative OECD data about R&D are presented in per cent of gross domestic pro-duct (GDP). Differences in GDP per head between individual countries however translate into substantial differences in actual R&D expenditures. For illustration, we therefore present a graph depicting the trend of gross national product (in fixed 1995 prices). Issues concerning broader inter-relation between macro-economic indicators and GDP are resolved in Chapter G, Economic per-formance and R&D. Data for the accompanying graph were taken from OECD statistics (in contrast to graph G1 which is based on EU statistics). |
Source: OECD - Main Science and Technology Indicators 1998/2
To compare the data for individual countries (except the USA) GDP originally expressed in national currencies was translated to USD using purchasing power parity.
Purchasing power parity (PPP) is a standard economic category; specific values for a given currency are calculated by means of a consensual method generally accepted throughout OECD (by analysing a market basket in each country). Without PPP any comparison of data for different countries would be meaningless.
In stable, low-inflation economies changes in purchasing power parity of national currencies are very small, in contrast to transforming economies experiencing higher rates of inflation.
Official documents state the following figures for PPP for the Czech koruna.
Purchasing Power Parity of CZK
(CZK/USD)
|
1993 |
1994 |
1995 |
1996 |
1997 |
1998 |
| PPP |
9.30 |
10.11 |
10.93 |
11.70 |
12.24 |
12.93 |
Source: OECD - Main Science and Technology Indicators 1998/2
Numbers of persons employed in the R&D sector have been reduced to Full Time Equivalent (FTE) according to OECD methodology since part-time employment is commonplace in the R&D sector, in particular in university R&D where a substantial part of time is devoted to teaching activities (the problem often is to differentiate between the two).
To compare the Czech Republic with developed countries thirteen OECD countries were selected in Chapter A: the first five (USA to Great Britain) belong to a group of most developed countries known as G7; the next four (Denmark to Finland) are approximately comparable to the Czech Republic as to size, and Greece is comparable to the Czech Republic also as to economic level although differences in the structure of the two economies are substantial. Portugal, another comparable country, is not included as data are mostly missing and, if available, are very similar to those of Greece. Hungary and Poland, two countries also aspiring at accession to the EU, are included. Graphs contain also a weighted average for the EU member states. Graphs A11 to A13 referring to R&D workforce do not depict the USA as OECD statistics fail to contain the relevant data.
B. ANALYSIS OF R&D EXPENDITURES FROM THE STATE BUDGET
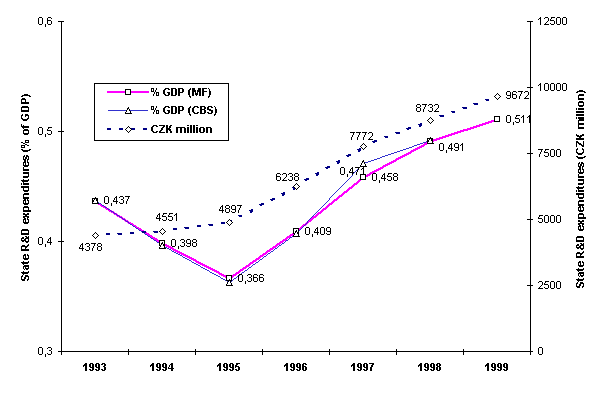
B1. Trends of state R&D expenditures
(Expressed in per cent of GDP and in CZK million a year, current prices)
| Source: |
Closing accounts (1993 to 1997) and the state budget (1998-99) of the Czech Republic; Czech Bureau of Statistics |
| Note: |
The figures referring to % GDP and R&D expenditures are based on data published by the Ministry of Finance (MF). The latter differ from data promulgated by the Czech Bureau of Statistics (CBS), employed in Chapter A. The above chart contains also the CBS data concerning % GDP. See also the commentary on Chart A2. |
Commentary
- The R&D expenditures expressed in current prices grew from 1993 to 1999. In fixed prices - cleared of inflation - the trend of R&D expenditures was less favourable.
- The effect of rapidly curtailed state expenditures on research and development in 1990 through 1992 is still apparent in the 1993 - 1995 data.
- A favourable change took place in 1996 and 1997 after adoption by the government of the first Principles Governing Research and Development (in 1994, as part of preparations for the 1995 budget, and therefore not yet reflected in the 1995 R&D budget). The slump apparent in expenditures expressed as % GDP in the preceding period, which reduced R&D expenditures in 1995 to 0.366 % of GDP, was arrested.
- Economic woes, apparent after 1997, together with the ensuing streamlined government expenditures resulted in a reduction of the rate of growth in state R&D expenditures.3
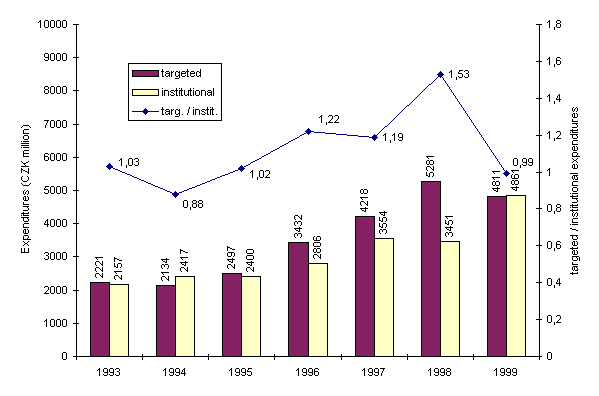
B2. Trend in targeted and institutional R&D expenditures
(CZK million in current prices and the ratio targeted/institutional expenditures)
Source: State budgets of the Czech Republic, 1993 - 1999
Commentary
- The institutional part of R&D expenditures increased until 1994; thereafter, since 1995 until 1998, the targeted part grew rapidly.
- The slump in targeted expenditures experienced in 1994 was due to the reduction of overall government R&D expenditures (expressed as % of GDP - see the graph in B1) and, accordingly, projects and programmes supported on the basis of tenders had to be curbed.
- After 1995 R&D expenditures began to rise (both in absolute terms and as a percentage of GDP), a trend reflected especially in targeted support extended to programmes and projects. The rate of growth was however still lower than the rate of inflation.
- In 1998 the targeted part of state expenditures on R&D reached its maximum. Objective and independent procedures for assessing proposed research plans (projects) in the Czech Republic were implemented at first in the area of targeted financing and, consequently, created favourable conditions for its faster development. The budget of each institutions from the preceding year, modified by a more or less common index, formed the basis of institutional financing and, consequently, this mode of support stagnated. As a reaction to inadequate growth of targeted financing the government adopted legislative measures - a new method of allocation of institutional expenditures, effective as of 1999, based on regular assessment of research plans and results of individual organisations.
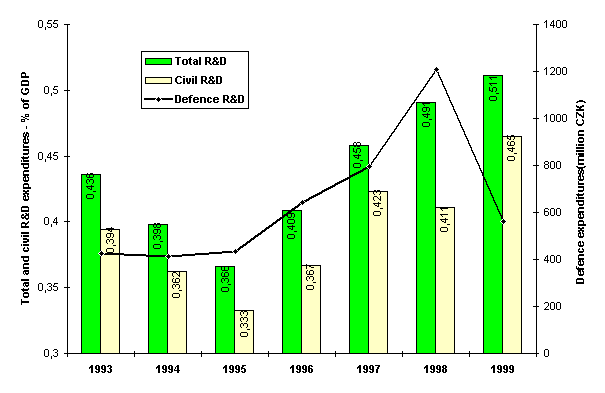
B3. Trend in state expenditures on civil and defence R&D
(in per cent of GDP; million CZK in current prices)
Source: State budget of the Czech Republic, 1993 - 1999
Commentary
- Till 1998 the expenditures for defence R&D followed the rate of growth of overall government R&D expenditures.
- The significant rise in defence R&D expenditures, experienced in 1998, was due to the fact that in 1998 the Ministry of Defence, pursuant to its internal methodical regulations, included in its R&D budget and subsequently financed expenditures of other than R&D character (the overall price of delivered systems and equipment associated with research and development was included in R&D expenditures). Thus, in 1998 the defence R&D expenditures formally amounted to 13.8 % of the total R&D expenditures, in other words, reached a level typical of nuclear powers (USA, Great Britain, France). This had the negative impact of reducing civil R&D expenditures.
- In 1999 the defence R&D expenditures returned to a level comparable with that of developed countries (5.8 % of total government expenditures - see A4).
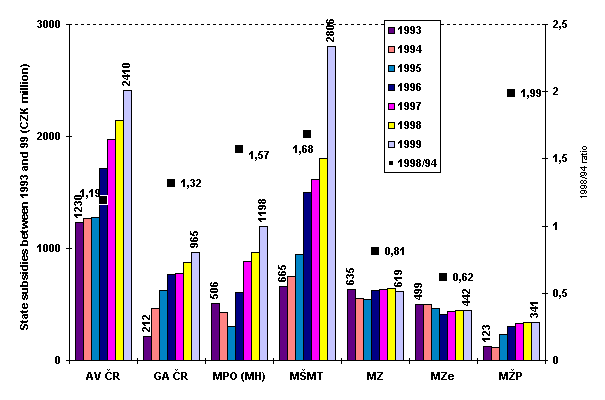
B4. Trend of state subsidies extended to research and development in some selected resorts
(Data for individual years are in CZK million; the ratio 1998/94 is in fixed 1994 prices)
| Source: |
State budget of the Czech Republic, 1993 - 1999 |
| Note: |
AV ČR - Czech Academy of Sciences; GA ČR - Czech Grant Agency; MPO - Ministry of Industry and Trade; MŠMT - Ministry of Education, Youth and Sport; MZ = Ministry of Health; MZe - Ministry of Agriculture; MŽP - Ministry of Environment; (MH refers to the now defunct Ministry of Economy, its compe-tence with regard to R&D passed to the Ministry of Industry and Trade in 1996). |
Commentary
- Data for individual years are in current prices. The 1998/1994 ratio, in fixed 1994 prices according to data promulgated by the Czech Bureau of Statistics, is also shown for the sake of comparison and indicates the significant effect of inflation.
- The state subsidies administered by MZe and MZ are almost constant in current prices (representing an actual decline in fixed prices); at present the proportion of total state subsidies roughly corresponds to support provided to analogous research in developed countries. The remaining resorts have experienced a growth, some even substantial.
- MPO: until 1995 the support provided to this ministry was insufficient. Its growth since 1996 corresponds to the importance of that ministry for research and development.
- GA ČR: the growth in the period 1993 to 1996 is in line with the importance ascribed to targeted financing of research and development and allocation of funds through grants. The initial rapid growth was followed by a moderate slowdown - the grant-based allocation of funds now reaches a maximum.
- AV ČR: expenditures remained at an almost constant level until 1995; a substantial growth started in 1996.
- MŠMT: the observed growth of allocated funds is given by the enormous increase of international activities of the Czech Republic and, in addition, ensues from legislative changes in the status and financing of tertiary education (see Commentary to B2).
C. ANALYSIS OF STATE-SUBSIDISED R&D PROJECTS (CEP)
C1. Classification of R&D projects by sector
(total number of projects per discipline, overall state subsidy in CZK million)

| Source: |
Central Evidence of Research and Development Projects in the Czech Republic Supported from the State Budget |
Commentary
- Technical sciences receive the largest amount of state subsidies devoted to research and development, partly owing to the fact that institutional financing of R&D is not implemented in the industry. Moreover, only in technical sciences is it apparent that the costs exceed the number of projects, in other words, projects in this area are the most comprehensive and the largest.
- Both the large number of projects and the large costs - compared with the situation abroad - in social sciences are remarkable; in monetary terms they amount to 9 % of the total of state subsidies devoted to R&D. In developed countries this proportion varies around 5 %. It may be in part attributed to development of some, previously neglected social sciences after 1989 and the situation in the culture sector, which between 1991 and 1995 did not support R&D.
- A large number of projects with small costs is typical of medicine. The fact that in the health care sector all targeted funds administered by the Ministry of Health are allocated by an internal grant agency to a large number of projects has a negative effect.
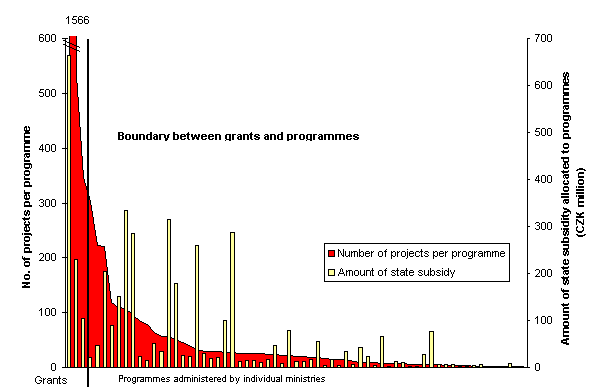
C2. Mean size of R&D programmes - 1998 data
(number of projects per programme, state subsidy granted to a prgramme in CZK million)
| Source: |
Central Evidence of Research and Development Projects in the Czech Republic Supported from the State Budget |
| Note: |
A Programme is put to tender by the relevant ministry (together with its objectives, term, etc.). Individual applicants submit projects covering a part of the promulgated programme objectives. The above graph shows the numbers of projects in individual programmes and the level of support granted (as no assessment of individual programmes is intended their names are omitted).
Programmes are listed in the graph by the number of projects in descending order. |
Commentary
- In 1998 one programme comprised 72 projects on the average and the state subsidy was 67 million CZK. Numbers of projects differ substantially among individual programmes.
- In 1998 62 programmes were supported along with three grant agencies (the Czech Grant Agency, an internal grant agency of the Czech Academy of Sciences, and an internal grant agency administered by the Ministry of Health). When ranked according to the number of projects per programme (or agency) the above three agencies assume the first three places on the left.
- More than 50 % of programmes contain less than 15 projects, one third of programmes have less than 10 projects, and one quarter of programmes have less than 5 projects. This demonstrates considerable fragmentation and lack of co-ordination of R&D programmes in the Czech Republic - programmes imple-mented by individual ministries solve highly specialised problems without close interaction between organisations from different resorts.
- The low number of projects per programme is in line with low overall costs of programmes and a low support from the state budget. With the exception of eight programmes the state subsidy never exceeds CZK 100 million per programme, and is smaller than CZK 10 million for one third of all programmes; large or medium-sized projects often represent separate programmes although they could be incorporated in existing ones.
- Large national research and development programmes, common in developed countries, are absent in the Czech Republic.
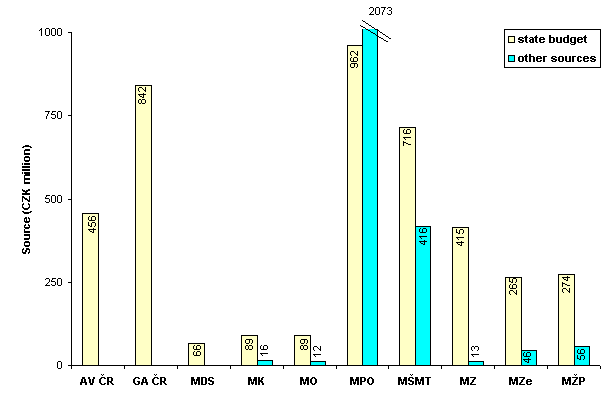
C3. Sources of financing R&D projects classified by resort - 1998 data
(sources of project financing in CZK million)
| Source: |
Central Evidence of Research and Development Projects in the Czech Republic Sup-ported from the State Budget |
| Note: |
AV ČR - Czech Academy of Sciences; GA ČR - Czech Grant Agency; MDS - Ministry of Transport and Communications; MK - Ministry of Culture; MO - Ministry of Defence; MPO - Ministry of Industry and Trade; MŠMT - Ministry of Education, Youth and Sport; MZ = Ministry of Health; MZe - Ministry of Agriculture; MŽP - Ministry of Environment |
Commentary
- The only resort where the financial contribution provided by project holders is higher than the state subsidy is the Ministry of Industry and Trade. The high level of participation of project holders, primarily corporate ones, ensues from the character of research and development projects and the imposed condition that no less than 50 % of the cost of projects with possible commercial use be covered by the project holder.
- Another resort where the participation of project holders is relatively high is the Ministry of Education, Youth and Sport which supports not only projects of universities but, as a national administration authority responsible for research and development, has in its remit international coopera-tion in research and development and administers a number of projects crossing sectoral boundaries, from research infrastructure to presentation of results. It is questionable whether all non-state sources of financing really stem from outside the state sector.
- Projects supported by the Academy of Sciences of the Czech Republic, the Czech Grant Agency and the Ministry of Transport and Communications are fully dependent on the state budget. In the first two instances basic research is primarily involved but a certain part of the projects bear the character of tar-geted (applied) research and, accordingly, their support from non-state resources must be raised in the future. As in foreign countries, the Ministry of Health also requires a high level of state support for its R&D projects.
- The fact that projects administered by the Ministry of Transport and Communi-cations are fully supported from the state budget indicates that projects dealing with state administration issues are primarily involved. This scope is very unusual in developed countries considering the remit of the ministry. The reason for the very low proportion of sponsors in financing individual projects in other resorts is similar.
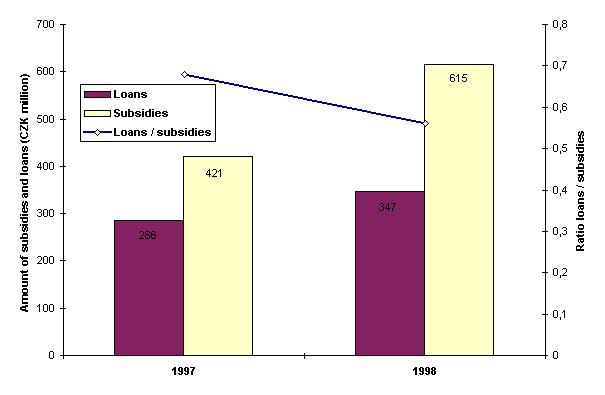
C4. Support extended to R&D through subsidies and loans provided by the Ministry of Industry and Trade in 1997 and 1998
(amount of subsidies and loans in CZK million and their ratio)
| Source: |
Central Evidence of Research and Development Projects in the Czech Republic Supported from the State Budget |
Commentary
- Support extended to projects through both subsidies (non-repayable funds) and loans (repayable funds) is practically applied only by the Ministry of Industry and Trade.
- The main criterion for deciding between a subsidy and a loan is the use of the project results. If the results are assigned for a single subject a loan is granted, otherwise a subsidy is preferred.
- The decreasing proportion of loans is connected with the fact that the number of projects eligible for a subsidy rose in 1998.
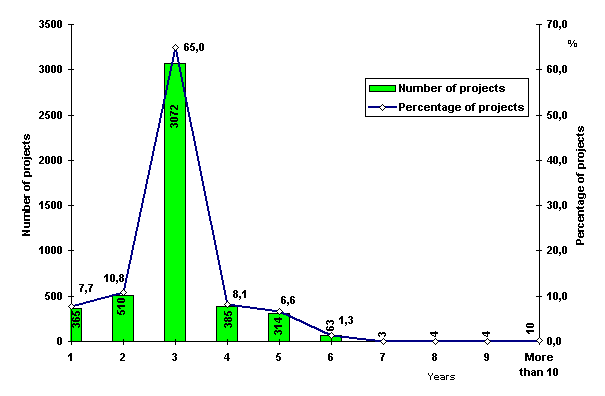
C5. Number of R&D projects and their mean term - 1998 data
(number of projects classified by their term in years; proportion of overall number of projects)
| Source: |
Central Evidence of Research and Development Projects in the Czech Republic Supported from the State Budget |
| Note: |
The term is given by the date of commencement and the completion date as agreed in the relevant contract. |
Commentary
- Three-year projects prevail not only for the grant agencies but also for programmes (their proportion increased by 15 % on the year 1995).
- Projects with terms in excess of seven years will be re-assessed and their poten-tial continuation reconsidered.
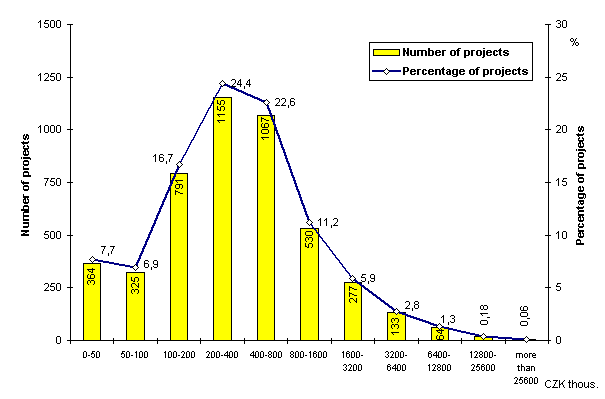
C6. Numbers of R&D projects by the amount of state subsidy - 1998 data
(numbers of projects in individual groups classified by the amount of state subsidy granted (CZK thousand and in per cent)
| Source: |
Central Evidence of Research and Development Projects in the Czech Republic Sup-ported from the State Budget |
Commentary
- Small projects preponderate over larger and more comprehensive ones. The majority of projects fall to the group between 200 and 400 thousand CZK. The mean size of projects and their classification is the same as that established by the last analysis on 1996. The number of projects in excess of 1.6 million CZK also did not increase significantly.
- Alarming is the number of projects in the category 50 to 100 thousand CZK, although they might refer to social sciences where the financial requirements are generally smaller.
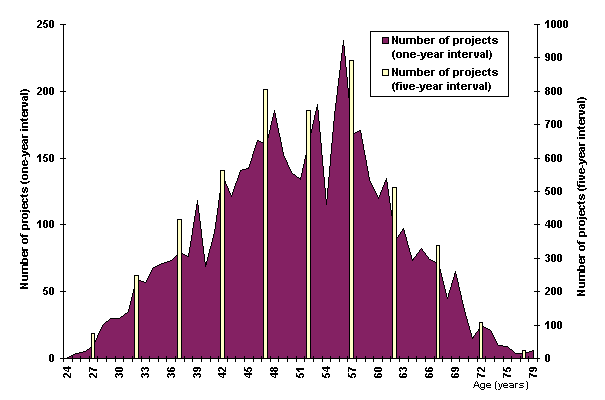
C7. Age of main R&D principal investigators - 1998 data
(number of projects classified by the age of the principal investigator; one-year and five-year classification)
| Source: |
Central Evidence of Research and Development Projects in the Czech Republic Sup-ported from the State Budget |
| Note: |
Principal investigator is the researcher accountable to the organisation for expertise of the solution. |
Commentary
- The mean age of principal investigators of projects in the Czech Republic is 50.9 years.
- The graph essentially corresponds to the standard stratification by age where however - compared with the situation three years ago - the number of principal investigators below the age of 40 is now significantly larger (the data are not fully comparable, though, since the definition of the term "principal investigator" has changed).
D. BIBLIOMETRIC ANALYSIS OF R&D RESULTS
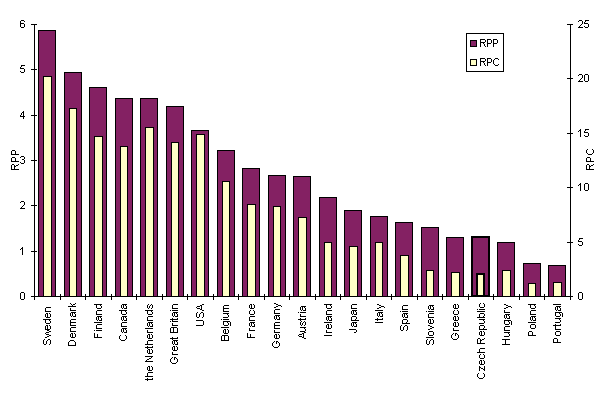
D1. Relative production of publications and citations, 1994 - 1997
(total number of publications/citations per 1000 inhabitants, 1994 - 1997)
| Source: |
National Science Indicators on Diskette, 1981 - 1997, version 1.2; database of summary publication and citation statistics reflecting research performance in the sciences, social sciences, and art & humanities (Institute for Scientific Information - ISI, USA) |
| Note: |
Relative publications production (RPP) and relative citations production (RPC) state the respective number of publications/citations per 1000 inhabitants in a given period. |
Commentary
- The RPP indicator enables one to compare bibliographic output, mostly of basic research, among different countries as it introduces a correction for country size.
- According to RPP the Czech Republic assumes 18th place among a group of selected 21 countries, at approximately the same level as Greece, somewhat better than Poland and Hungary, and substantially better than Portugal. Remark-able is the relative productivity of Sweden as well as Denmark and The Nether-lands.
- Production of citations is to a certain extent correlated with the production of publications. More publications however do not necessarily ensure a higher number of citations. Only some 40 to 60 % of publication are usually cited. The uncertainty in the RPC indicator is associated with the fact that autocitation cannot be excluded at present.
- According to RPC the Czech Republic assumes 19th place among the 21 coun-tries included in the selection. As with RPP it is in the same group as other associated countries (AEU) and economically weaker EU states. In this com-parison the Czech Republic is behind Hungary and Slovenia but before Poland and Portugal.
- Comparison of selected groups of countries and the Czech Republic according to relative publications/citations production:
| Country |
RPP |
RPC |
| G7 |
3.06 |
10.68 |
| EU |
2.81 |
8.69 |
| AEU |
0.92 |
1.59 |
| Czech Republic |
1.30 |
2.05 |
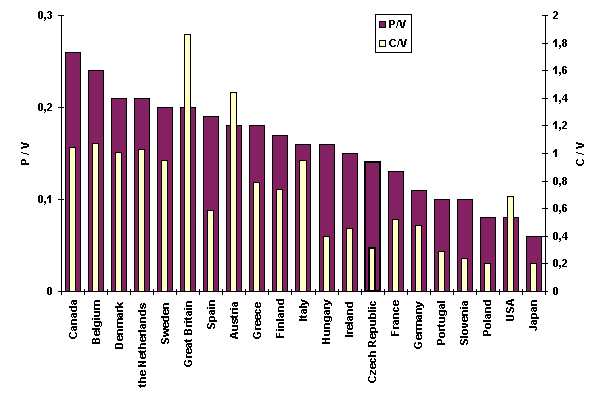
D2. Annual productivity of publications and citations - 1995 data
(mean number of publications/citations per researcher in a given year)
| Source: |
National Science Indicators on Diskette, 1981 - 1997, version 1.2; database of summary publication and citation statistics reflecting research performance in the sciences, social sciences, and art & humanities (Institute for Scientific Information - ISI, USA), MTI database 1998/2 OECD |
| Note: |
Annual publications productivity (P/V) and annual citations productivity (C/V) indicate the number of publications/citations per R&D employee (expressed as FTE) in a given year. The data for Austria, Greece and Great Britain refer to 1993, those for Italy and USA to 1994, for the remaining countries to 1995. |
Commentary
- In comparison with foreign countries the position of the Czech Republic with regard to the annual productivity indicators is more favourable than that meas-ured by relative production owing to the smaller number of R&D employees. In this respect the Czech Republic beats not only Poland and Portugal but also such R&D superpowers like France and Germany.
- Ranked according to annual productivity of publications the Czech Republic with a value of 0.14 assumes a position close to the mean calculated for all 21 countries. The leader (Canada) however attains twice the annual productivity of publications than that reported for the Czech Republic. In classification accord-ing to annual production of citations the first place belongs to Great Britain; the leading position assumed by Austria and the two small countries - Denmark and Belgium - is also remarkable.
- Comparison of selected groups of countries and the Czech Republic according to annual publications/citations production:
| Country |
P/V |
C/V |
| G7 |
0.10 |
0.65 |
| EU |
0.16 |
0.86 |
| AEU |
0.11 |
0.25 |
| Czech Republic |
0.14 |
0.31 |
D3. Bibliometric quality of publications , 1994 - 1997
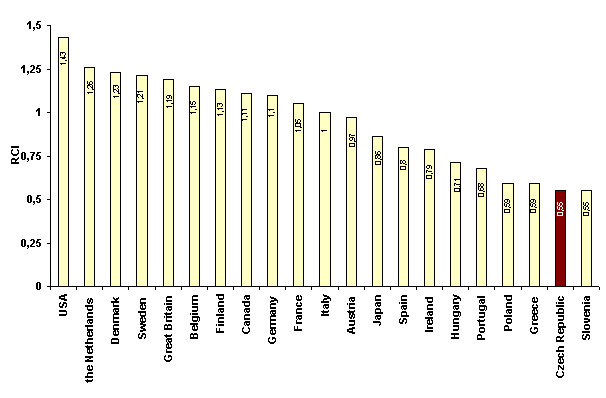
(relative citation impact - RCI)
| Source: |
National Science Indicators on Diskette, 1981 - 1997, version 1.2; database of summary publication and citation statistics reflecting research performance in the sciences, social sciences, and art & humanities (Institute for Scientific Information - ISI, USA) |
| Note: |
Citation impact (index) indicates the mean number of citations per publication. Relative citation impact is the citation impact of a given country divided into the citation impact of the world base. RCI > 1 indicates that the rate of citations is higher for a given country than the "world average", RCI < 1 indicates the opposite. |
Commentary
- Together with Slovenia the Czech Republic assumes the bottom place among the 21 countries ordered by decreasing value of RCI. RCI = 0.55 for the Czech Republic indicates that the bibliometric quality of publications stemming pri-marily from basic research is about one half that of the world average.
- In a group of 100 countries ordered according to decreasing value of RCI the Czech Republic assumes 45th place, and lags not only behind Hungary and Poland but also behind Lithuania, Estonia and some so-called developing coun-tries (Indonesia - 0.63, Thailand - 0.67, Tanzania - 0.80, Uruguay - 0.89).
- In view of the high robustness of the RCI indicator and its relation to the worldwide database its information content in comparing individual countries is very high.
- Comparison of selected groups of countries and the Czech Republic according to annual publications/citations production:
| Country |
Relative citation impact |
| G7 |
1.23 |
| EU |
1.09 |
| AEU |
0.60 |
| Czech Republic |
0.55 |
D4. Comparison of scientific disciplines in the Czech Republic and the world - 1994 to 1997
(according to relative citation impact for disciplines - RCIO - for the period 1994 - 1997)
| |
World leader in discipline |
Position of
Czech
discipline in
the world |
|
World leader in discipline |
Position of
Czech
discipline in
the world |
| Discipline |
Place |
Country |
RCIO |
Place |
RCIO |
Discipline |
Place |
Country |
RCIO |
Place |
RCIO |
| Astrophysics |
1 |
USA |
1.36 |
30 |
0.40 |
Microbiology |
1 |
USA |
1.40 |
38 |
0.35 |
|
2 |
Israel |
1.34 |
|
|
2 |
Hong Kong |
1.30 |
|
3 |
Canada |
1.31 |
|
|
3 |
Belgium |
1.27 |
|
4 |
Chile |
1.28 |
|
|
4 |
Switzerland |
1.23 |
Biology and
biochemistry |
1 |
USA |
1.40 |
38 |
0.37 |
Molecular
biology and
genetics |
1 |
Switzerland |
1.41 |
26 |
0.48 |
|
2 |
Switzerland |
1.36 |
2 |
USA |
1.38 |
|
3 |
Israel |
1.08 |
3 |
Great Britain |
1.19 |
|
4 |
Germany |
1.08 |
4 |
Ireland |
1.09 |
Ecology and
the
ennvironment |
1 |
Switzerland |
1.81 |
33 |
0.62 |
Multidisciplinary |
1 |
Germany |
1.75 |
26 |
0.62 |
|
2 |
Netherlands |
1.31 |
2 |
Sweden |
1.66 |
|
3 |
Sweden |
1.31 |
3 |
USA |
1.47 |
|
4 |
Finland |
1.28 |
4 |
Israel |
1.42 |
Economy
and business |
1 |
USA |
1.22 |
38 |
0.10 |
Neurological
sciences |
1 |
USA |
1.27 |
28 |
0.58 |
|
2 |
Israel |
1.09 |
2 |
Switzerland |
1.24 |
|
3 |
Sweden |
1.03 |
3 |
Great Britain |
1.09 |
|
4 |
France |
0.93 |
4 |
Germany |
1.05 |
| Pharmacology |
1 |
Switzerland |
1.89 |
25 |
0.67 |
Informatics |
1 |
USA |
1.37 |
9 |
1.07 |
|
2 |
New Zealand |
1.67 |
2 |
Switzerland |
1.35 |
|
3 |
Great Britain Británie |
1.53 |
3 |
Israel |
1.34 |
|
4 |
Sweden |
1.38 |
4 |
Norway |
1.30 |
| Physics |
1 |
Switzerland |
2.00 |
36 |
0.72 |
Psychology and
psychiatry |
1 |
USA |
1.19 |
33 |
0.25 |
|
2 |
Columbia |
1.81 |
2 |
New. Zealand |
1.14 |
|
3 |
USA |
1.56 |
3 |
Ireland |
1.13 |
|
4 |
Denmark |
1.51 |
4 |
Great Britain |
1.11 |
| Chemistry |
1 |
Switzerland |
1.62 |
29 |
0.68 |
Social sciences
general |
1 |
Kenya |
1.31 |
38 |
0.37 |
|
2 |
USA |
1.57 |
2 |
USA |
1.19 |
|
3 |
Denmark |
1.44 |
3 |
Italy |
1.04 |
|
4 |
Israel |
1.40 |
4 |
Spain |
1.02 |
| Immunology |
1 |
Switzerland |
1.39 |
25 |
0.53 |
Material
sciences |
1 |
Switzerland |
1.62 |
24 |
0.78 |
|
2 |
USA |
1.30 |
2 |
Israel |
1.42 |
|
3 |
Belgium |
1.14 |
3 |
USA |
1.38 |
|
4 |
Germany |
1.08 |
4 |
Netherlands |
1.38 |
| Engineering |
1 |
Switzerland |
1.77 |
14 |
1.16 |
Botany and
zoology |
1 |
Switzerland |
1.51 |
49 |
0.54 |
|
2 |
Denmark |
1.59 |
2 |
Great Britain |
1.40 |
|
3 |
Sweden |
1.57 |
3 |
Panama |
1.39 |
|
4 |
Spain |
1.43 |
4 |
Netherlands |
1.38 |
Clinical
medicine |
1 |
Iceland |
1.63 |
25 |
0.75 |
Earth sciences |
1 |
Iceland |
1.65 |
30 |
0.53 |
|
2 |
USA |
1.37 |
2 |
USA |
1.44 |
|
3 |
Netherlands |
1.34 |
3 |
Germany |
1.22 |
|
4 |
Canada |
1.24 |
4 |
Denmark |
1.18 |
| Mathematics |
1 |
Norway |
1.54 |
8 |
1.10 |
Agricultural
sciences |
1 |
Great Britain |
1.38 |
44 |
0.40 |
|
2 |
Denmark |
1.49 |
2 |
Sweden |
1.38 |
|
3 |
Belgium |
1.45 |
3 |
Denmark |
1.37 |
|
4 |
Great Britain |
1.43 |
4 |
Netherlands |
1.36 |
| Source: |
National Science Indicators on Diskette, 1981 - 1997, version 1.2; database of summary publication and citation statistics reflecting research performance in the sciences, social sciences, and art & humanities (Institute for Scientific Information - ISI, USA) |
| Note: |
The RCIO indicator compares bibliometric quality of publication from a given dis-cipline in a given country with the worldwide level of bibliometric quality in that discipline (bibliometric quality of publications - see D3). RCIO (relative citation impact of a discipline) can be calculated as the citation impact of the country divided into the citation impact of the same discipline in the worldwide database. RCIO = 1 indicates that the quality of publications from the discipline in question in the country is the same as the worldwide average calculated for that discipline. RCIO > 1 indicates a level higher than average and vice versa. |
Commentary
- In most instances countries with developed economies, G7 and EU, assume the leading position in individual scientific disciplines. From the point of view of bibliometric indicators, Switzerland has won an excellent position among Euro-pean countries. The top countries in all disciplines enjoy above-average values of the RCIO indicator. Thus, in physics the value determined for Switzerland is almost twice as high as the world average in that discipline, no doubt owing in part to the international research centre CERN.
- Not only the R&D superpowers but a number of smaller countries enjoy a prominent position in some disciplines, e.g., Israel (astrophysics, biology and biochemistry, materials sciences, computer sciences, economy and business), Island (earth sciences), Ireland (molecular biology and genetics), or Hong Kong (microbiology). Specialisation of a country is the result of scientific policies of its government directed towards incorporation of own R&D in solving specific problems. A long-term massive support extended to selected scientific disci-plines is prerequisite for excellence.
- According to RCIO the Czech Republic assumes a position roughly in the second third of the examined set of countries with RCIO < 1, with the exception of three successful disciplines (engineering, mathematics, and computer science).
- Ranking of scientific disciplines in the Czech Republic according to RCIO and its comparison with the world (1994 - 1997):
| Rank in the Czech Republic |
Discipline |
Rank in the world |
RCIO |
| 1 |
Engineering |
14 |
1.16 |
| 2 |
Mathematics |
8 |
1.10 |
| 3 |
Informatics |
9 |
1.07 |
| 4 |
Material sciences |
24 |
0.78 |
| 5 |
Clinical medicine |
25 |
0.75 |
| 6 |
Physics |
36 |
0.72 |
| 7 |
Chemistry |
29 |
0.68 |
| 8 |
Pharmacology |
25 |
0.67 |
| 9 |
Ecology and environment |
33 |
0.62 |
| 10 |
Multidisciplinary |
26 |
0.62 |
| 11 |
Neuroscience |
28 |
0.58 |
| 12 |
Botany and zoology |
49 |
0.54 |
| 13 |
Immunology |
25 |
0.53 |
| 14 |
Earth sciences |
30 |
0.53 |
| 15 |
Molecular biology and genetics |
26 |
0.48 |
| 16 |
Astrophysics |
30 |
0.40 |
| 17 |
Agricultural sciences |
44 |
0.40 |
| 18 |
Biology and biochemistry |
38 |
0.37 |
| 19 |
Social sciences, general |
38 |
0.37 |
| 20 |
Microbiology |
38 |
0.35 |
| 21 |
Psychology and psychiatry |
33 |
0.25 |
| 22 |
Economy and business |
38 |
0.10 |
- Measured by RCIO only three disciplines exhibit above-average levels of bib-liometric quality of publications, the following ten disciplines are at a moder-ately good level (above one half the mean world level), the remaining are below average.
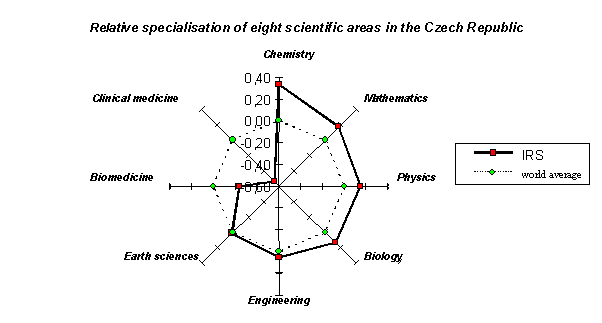
D5. Specialisation of main scientific areas in the Czech Republic, 1994 - 97
(according to index of relative specialisation - IRS)
| Rank |
Scientific area groups |
Activity index |
IRS |
| 1 |
Chemistry |
2.00 |
0.33 |
| 2 |
Mathematics |
1.41 |
0.17 |
| 3 |
Physics |
1.34 |
0.15 |
| 4 |
Biology |
1.32 |
0.14 |
| 5 |
Engineering |
1.11 |
0.05 |
| 6 |
Earth sciences |
1.02 |
0.01 |
| 7 |
Biomedicine |
0.61 |
-0.24 |
| 8 |
Clinical medicine |
0.30 |
-0.54 |
| Source: |
National Science Indicators on Diskette, 1981 - 1997, version 1.2; database of summary publication and citation statistics reflecting research performance in the sciences, social sciences, and art & humanities (Institute for Scientific Information - ISI, USA) |
| Note: |
Index of relative specialisation (IRS) is based on production of publications (without reference to their quality) and is defined as IRS = (IA - 1)/(IA + 1), where IA (index of activity) is the proportion of publications from a given discipline in the country in world publications from the same discipline, divided into the proportion of all publication of the country in all world publications. IRS = 0 corresponds to the world average in a given discipline, IRS > 0 (IRS < 0) indicates higher (lower) than average activity.
Scientific disciplines representation is in this instance defined as groups of the original representations defined pursuant to the ISI methodology. |
Commentary
- For the sake of clarity the results are presented as a "radar" diagram. The diagram clearly reveals the dominance of chemistry and higher-than-average activity in mathematics, physics and biology.
- Activity in the groups of disciplines (clusters) biomedicine and clinical medicine is significantly below the world average. Almost all EU member states are increasingly active in these disciplines.
- The position of Earth sciences corresponds to the world activity in this area.
D6. Czech periodicals listed in SCI - 1997 data
(ordered according to relative rank in the corresponding group of periodicals)
| Rank |
Periodical |
PIF |
Max.PIF |
Relative rank |
| 1 |
European Journal of Entomology |
0.858 |
5.75 |
19 |
| 2 |
Photosynthetica |
0.941 |
17.02 |
40 |
| 3 |
Kovové materiály |
0.208 |
4.57 |
58 |
| 4 |
Collection of Czech. Chem.Com. |
0.550 |
18.29 |
64 |
| 5 |
Physiological Research |
0.807 |
19.26 |
68 |
| 6 |
Folia Biologica |
0.522 |
14.63 |
68 |
| 7 |
Folia Zoologica |
0.364 |
3.76 |
71 |
| 8 |
Folia Parazitologica |
0.716 |
5.24 |
71 |
| 9 |
Rostlinná výroba |
0.214 |
2.107 |
72 |
| 10 |
Živočišná výroba |
0.194 |
2.04 |
75 |
| 11 |
Biologia Plantarum |
0.393 |
17.02 |
77 |
| 12 |
Veterinární medicina |
0.213 |
1.95 |
80 |
| 13 |
Folia Geobotanica & Phytotaxonomia |
0.361 |
17.02 |
82 |
| 14 |
Kybernetika |
0.149 |
1.35 |
83 |
| 15 |
Ceramics - Silikáty |
0.098 |
1.46 |
86 |
| 16 |
Neoplasma |
0.385 |
11.40 |
87 |
| 17 |
Chemické Listy |
.0159 |
18.29 |
89 |
| 18 |
Acta veterinaria Brno |
.0132 |
1.95 |
90 |
| 19 |
Czechoslovak Journal of Physics |
0.212 |
12.62 |
90 |
| 20 |
General Physiology and Biophysics |
0.259 |
19.26 |
94 |
| 21 |
Folia Microbiologica |
0.312 |
18.15 |
94 |
| 22 |
Listy cukrovarnické |
0.038 |
2.11 |
95 |
| 23 |
Czechoslovak Mathematical Journal |
0.078 |
2.07 |
96 |
| 24 |
Acta Virologica |
0.454. |
5.82 |
100 |
| Source: |
SCI Journal Citation Reports 1997, Key Figures from Journal Rankings 1991 - 1997 |
| Note: |
Periodical Impact Factor (PIF) is defined as a ratio where the number of articles published in the assessed journal during the last two years and cited in any journal included in the assessment is in the numerator, and the denominator is the sum total of articles published in the assessed journal during the last two years. |
Commentary
- According to available information ISI indexes 24 periodicals - specialised scientific journals (0.99 %) - out of the total of 2421 periodicals that appeared in the Czech Republic in 1998.
- The Academy of Sciences of the Czech Republic edits 89 specialised periodicals, of which ISI indexes only 12 (a mere 13.5 %).
- Periodicals are listed in the above Table in the order of the relative rank (last column) they assume in the set of other periodicals covering the same scientific discipline according to a statistical weight equal to the corresponding PIF listed in column 3 of the Table. For the sake of comparison column 2 shows the maximum value of PIF attributed to the leading periodical in the given discipline. For the sake of clarity the rank was transformed to the interval 1 to 100 for all disciplines (where 1 corresponds to the best and 100 to the relatively worst periodical).
- From this point of view the first two journals are at a good European level, the remaining fall to the second half of the list for the given discipline. The predictive value of PIF for periodicals issued in small countries with regard to the level of research in those countries is rather limited. Incorporation of twenty plus journals appearing in the Czech Republic in the evaluated set is gratifying, though.
- It is of interest that also periodicals assigned for the community of Czech experts, where articles appear in Czech with an English abstract (e.g. Chemické listy), assume a very creditable place compared with other local journals published in a world language.
D7. Bibliometric data - sources and methodology
Articles published in specialised periodicals rank among the main results of research activity. It is therefore quite natural that the number of publications and their international impact (citation index) is used as a criterion of success and performance. The relatively high impartiality of the number of publications and citations as a criterion of research success is however somewhat restricted in some disciplines of social sciences. These so-called bibliometric data collected for the Czech Republic and other countries are presented in Chapter D of this analysis. They were taken from the database National Science Indicators on Diskette 1981 - 1997, version 1.2 (hereinafter NSIOD) of the US Institute for Scientific Information (ISI). The database contains publication and citation statistics that enable one to examine scientific performance in natural and social sciences. The NSIOD database lists he numbers of publications and citations from a pre-defined set of judiciously selected international periodicals whose level is so high that they represents more than 90 per cent of the overall scientific output. The database lists exclusively periodicals in which papers appear only when first reviewed by independent experts and included in impacted journals. In 1997 the ISI database listed 8099 scientific journals.
Scientific disciplines are classified in NSIOD according to categorisation used, with certain modifications, by ISI in Current Contents (a Journal-to-Field Scheme). Publications are attributed to individual fields according to reference of the journals in which they appear. In the standard NSIOD version each journal is included in one of 23 fields (plus the field "multidisciplinary"). The definitions of scientific disciplines are based on bibliometry and are not strictly in line with the definition of scientific disciplines according to the subject matter.
In the standard NSIOD version used in the presented analysis the world production is characterised by scientific performance of 100 most productive countries. This set of countries represents the world in its entirety and values of bibliometric indicators in the world database are used as reference.
Data can be analysed in the database by one-year or five-year intervals between 1981 and 1997 either separately or cumulatively over the entire seventeen-year period, or cumulatively over the last five years. The split of former Czechoslovakia in 1993 represents a specific problem in using NSIOD to analyse the Czech Republic.
Full-fledged data for Czechoslovakia are available until the beginning of 1993 and definitely end in 1995, while full-fledged data for the Czech Republic and Slovakia as the successor states are available only from the beginning of 1994 (see the graph D7a). For this reason the present analysis covers the interval 1994 to 1997. The authors of the bibliometric part of the analysis are fully aware of the fact that the results for the last four years are uncertain due to the high rate of citations in the period immediately following publication. An interval covering a period of several years after publication is usually selected for analytical purposes as it provides relatively stable indicators (where however disciplines characterised by a rapid citation response are put at a disadvantage). Taking into account that the decisive indicators refer to the world database, which exhibits a similar time dependence as individual countries, their comparison is unbiased.
D7a. Trend of the ISI database following split of Czechoslovakia - time dependence of the RCI indicator
(RCI - relative citation impact)

| Source: |
National Science Indicators on Diskette, 1981 - 1997, version 1.2; database of summary publication and citation statistics reflecting research performance in the sciences, social sciences, and art & humanities (Institute for Scientific Information - ISI, USA) |
Citation impacts of disciplines - CIO - cannot be directly compared as the cita-tion rate differs among individual disciplines, and must be referred to the world average of publication quality in each discipline separately, i.e., compared using the relative citation impacts (RCIOs). This is illustrated in the following graph D7b.
D7b. Comparison of relative citation impacts (RCIO) and impact indices of disciplines (IIO) for the Czech Republic
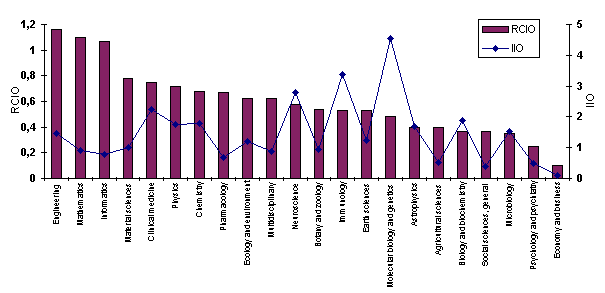
| Source: |
National Science Indicators on Diskette, 1981 - 1997, version 1.2; database of summary publication and citation statistics reflecting research performance in the sciences, social sciences, and art & humanities (Institute for Scientific Information - ISI, USA) |
D8. Relative production of publications in CC(LS) - 1998 data
(number of publications per 100,000 inhabitants in 1998 in a given country)
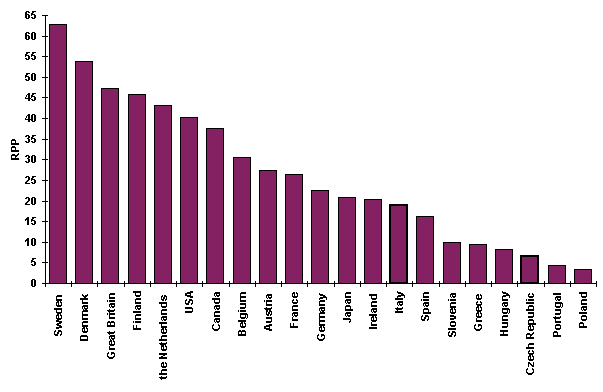
| Source: |
Current Contents Life Sciences (CC-LS) 1998 |
| Note: |
Relative production of publications indicates the number of publications per 100,000 inhabitants in a given country. Owing to the smaller scope of the database compared with SCI a scale one-hundred-times larger was employed; otherwise the meaning of the indicator is the same as in D1. |
Commentary
- A complementary view of production of publications is provided by another ISI product, Life Science Series, that summarises information about publications that appeared in 1 374 periodicals devoted to life sciences. 248,381 articles from 21 monitored countries appeared in 1998.
- In 1994 - 1997 the results (per scientific discipline per year) are similar as in the assessment based on NSIOD (see D1). The Czech Republic assumes 19th place, trailed only by Poland from among the associated countries.
- An analogous analysis was carried out also for the series Current Contents Agriculture, Biology and Environmental Sciences (CC-ABES) which comprises information about publications that appeared in 999 periodicals, where 78,050 articles appeared in 1998 from 21 monitored countries. Here the Czech Republic assumes 14th place trailed by all associated countries.
E. ANALYSIS OF PATENTS AS R&D RESULTS
E1. Patent applications filed in the Czech Republic between 1993 and 98
(domestic and foreign patent applications, PCT designations)
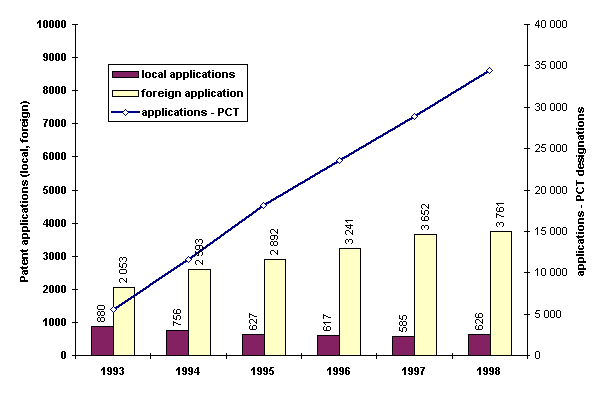
| Source: |
Industrial Property Office |
| Note: |
Applications filed in PCT member states in which the Czech Republic is designated by the applicant pursuant to the Patent Cooperation Treaty as the country in which the applicant seeks to obtain protection. The number of international applications in which the Czech Republic is denoted as the designated country is plotted on the ordinate. |
Commentary
- The slump in the number of patent applications filed by Czech subjects levelled off after 1994 and at present remains essentially constant. The trend is due to several factors - lack of innovations that could be transformed into a patent application form, insufficient interest of entrepreneurs in legal protection of their com-petitive edge, and probably also lack of funds necessary for obtaining a patent.
- The rise by almost 10 % experienced in 1998 is promising but can be hardly interpreted as a permanent turn for the better. Most domestic patent applications refer to measurement and testing.
- Foreign applications are filed by subjects from abroad that seek to obtain protection in the territory of the Czech Republic. The associated costs are considerable (administration fees, translation into Czech, services of a patent attorney) and must be invested up-front, regardless of the outcome. Most foreign applications are filed by subjects from Germany and the USA (in 1998 1147 and 933 applications, respectively). Most applications refer to organic chemistry.
- International patent applications PCT, where the Czech Republic is a member since 1993, enable one to apply for protection in more than one state at the same time for a reasonable fee. International search and preliminary examination are prepared centrally to avoid duplicity, and the result is an acid test of potential success of national stage of the application. The latter imposes similar demands as international application but with a considerably reduced risk of failure and at substantially lower costs. Accordingly, the number of PCT applications in general grows, in the Czech Republic linearly since it became a member.
E2. Utility model applications in the Czech Republic, 1993 - 98
(local and foreign utility model applications)
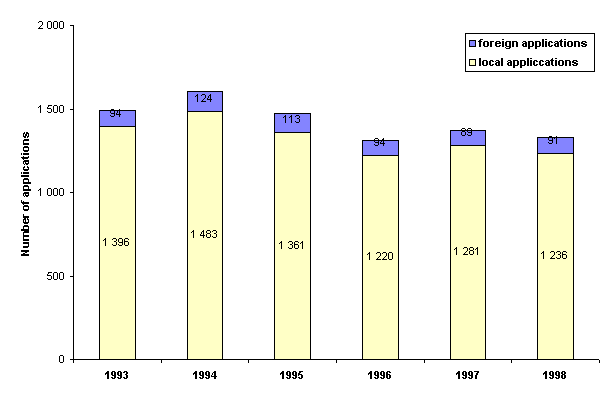
| Source: |
Industrial Property Office |
| Note: |
The institute of utility model ("new, industrially applicable technical solution exceeding the framework of a mere expertise ") is used in some countries. Protec-tion of utility models is based on a registration principle. The procedure is simpler and cheaper but the protection period is shorter. In the Czech Republic this protec-tion was introduced in 1992. |
Commentary
- The number of utility model applications filed by domestic subjects is about twice that of patent applications. Abroad - in countries where protection of utility models is implemented - the number of patent applications is usually much higher. The reason for the preference given to utility models in the Czech Republic lies in the level of the technical solutions involved, the simplified procedure resulting in an early registration (3 to 4 months compared with 4 to 5 years in case of patents), and lower cost.
- After the initial rapid rise the number of utility model applications essentially stagnates, in line with the number of patent applications. In 1998 most utility model applications referred to transportation, packaging and storage and also construction of buildings, all fields with only moderate demands on R&D. Most applicants in 1998 came from Slovakia.
E3. Patent applications in some selected countries and the Czech Republic - 1993 - 96
(local and foreign patent applications)
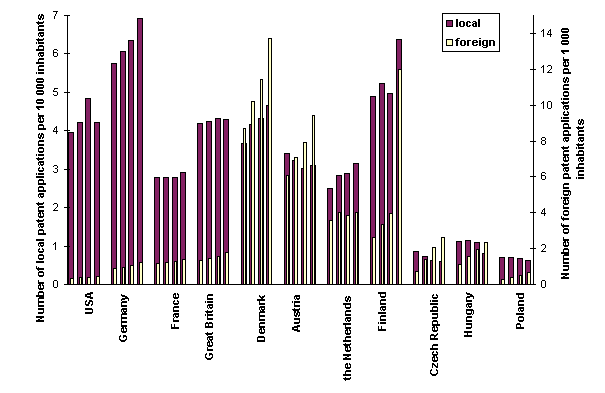
| Source: |
WIPO Statistics; Industrial Property Office Bulletin
OECD - Main Science and technology Indicators 1998/2 (numbers of inhabitants) |
Commentary
- The number of foreign patent applications filed in small countries by foreign subjects is considerably higher than that filed by local subjects but the dif-ference is smaller for large countries. In the USA the former approaches the latter.
- Owing to economic globalisation the number of foreign patent applications usually grows at a higher rate than that of domestic applications.
- A high number of patent applications filed by subjects resident in the country is typical of the USA and Germany but also of some smaller countries, notably Finland and Denmark.
- In transforming economies - Poland, Hungary and the Czech Republic - the activity of inventors stagnates or slowly decreases.
- Inventors' activity increases rapidly in Finland. Moreover, Finland attains remarkable results also with regard to other indicators measuring technological level such as R&D expenditures, competitiveness, number of scientific papers, etc. as well as their trends. High rate of growth in the number of domestic applications is typical also of Germany and Denmark.
E4. Patent applications by sector in the EU and in the Czech Republic - 1996 data
(participation of sectors in the sum total of patent applications filed in 1996)
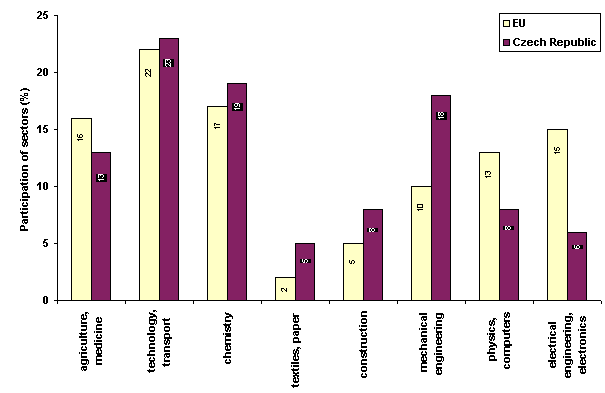
| Source: |
Statistics INFOCUS (UN) |
| Note: |
Sectors (groups or branches) classified according to international patent classification |
Commentary
- In 1996 the Czech Republic registered a higher number of patent applications than the EU in the following sectors: D - textile and paper; E - construction; F - mechanical engineering. All the above are sectors less demanding on research and development, where inventions appear not only as a result of R&D.
- In 1996 the European Union (as a whole) exhibited a larger proportion of patent applications in the following sectors: A - agriculture and medicine; G - physics and computers; H - electrical engineering and electronics, all sectors imposing high demands on R&D.
- Characteristics of the EU and the Czech Republic are almost identical in sectors B - technology and transport and C - chemistry.
E5. Activity of inventors in some selected countries between 1993 and 1996 Inventiveness coefficient (resident patent applications per 10 000 inhabitants)
(inventions per ten thousand inhabitants in individual countries)
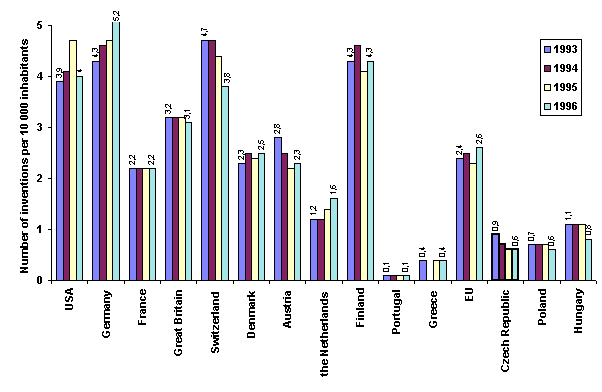
| Source: |
OECD - Main Science and Technology Indicators 1998/2 |
Commentary
- The relatively high inventiveness coefficient characterising Switzerland is apparently connected with the prevalent private (non-state) financing of R&D and the ensuing higher demand for innovation and profit. A somewhat different patent system may also play a role (patent search is carried out only with some patent classes while the remaining classes are only registered).
- The high inventors' activity in Germany is traditional and, in view of the size of the country, also highly beneficial to the world technical level. The same applies still more to the USA.
- The inventors' activity in Finland is surprising and for the Czech Republic very illuminating. Abolishing the strong relationship to the Soviet (Russian) economy and shaking off the political influence of the powerful neighbour has resulted in an extraordinarily rapid progress, deliberately based on support extended to research and development and transfer of new technologies to both industry and services. Finnish hi-tech products find they way to the most demanding markets.
- In the Czech Republic the slump in the number of inventions at the beginning of the 1990s was followed by stagnation (Year/number of applications: 1993/894; 1994/757; 1995/627; 1996/617; 1997/585). Its long duration is a distinctly negative signal. A similar situation prevails in Hungary and Poland.
E6. Rate of diffusion (external/resident patent applications)
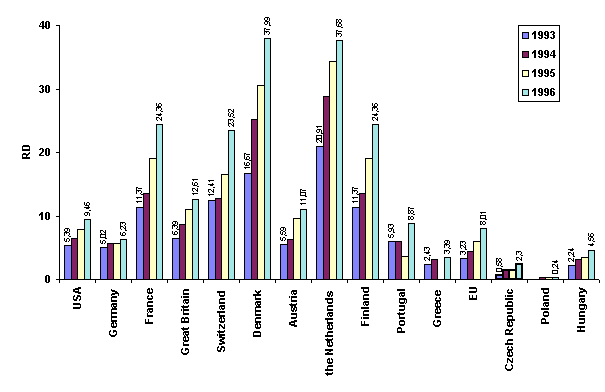
| Source: |
OECD - Main Science and Technology Indicators 1998/2 |
| Note: |
Rate of diffusion is defined as the number of resident patent applications filed abroad divided into the number of resident patent application filed in the country of residence. |
Commentary
- With the notable exception of Poland all countries report higher numbers of resident applications filed abroad than locally. Thus, protection for a considerable proportion of inventions is demanded abroad. Tens of countries are involved in case of Denmark and The Netherlands. In general big countries disseminate their inventions to a lesser extent than small countries of analogous innovative activity.
- The low rate of diffusion typical of the Czech Republic is primarily due to poor level of the applications and also to lack of funds necessary for filing and maintaining patents.
E7. Autosufficiency ratio (resident/national patent applications)
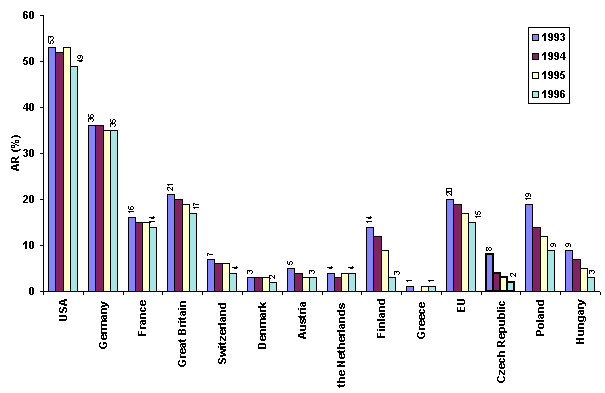
| Source: |
OECD - Main Science and Technology Indicators 1998/2 |
| Note: |
Autosufficiency ratio (AR) of patents is defined as the percentage of national applications filed by residents in the total number of national patent applications. |
Commentary
- The AR indicator reflects a number of factors. In addition to the size and diversity of the economy (the larger and the more diversified the more self-suf-ficient), they include activity of local inventors as well as prudence exercised by foreign applicants.
- Higher self-sufficiency naturally follows from higher activity of resident inven-tors but is also enhanced if the risk for foreign subjects that their inventions will be used free of charge in a given country is low. In the event the above risk is considerable, foreign subjects tend to protect their inventions by means of pat-ents. This is apparently the case of Switzerland, a country where the number of inventors is very high (see E.5), but where many foreign inventions are also patented so that paradoxically Switzerland exhibits a relatively small level of self-sufficiency.
E8. Inventions and patents - commentary
A substantial part of research and development is carried out with the aim to obtain new knowledge to be applied to new products, technologies and services. Legal protection of research and development results ensures exclusive rights, a privileged status and lead of the owner of such intangible assets to use it, grant licence to use or transfer it to other subjects. In most instances an invention without legal protection fails to ensure return on invested means, effort, and time.
With regard to assessment of research and development results, a granted patent is taken to be a certificate of successful work of the investigator. Patents are namely granted only to solutions that are new worldwide, can be used industrially, and are the result of inventive activity, i.e., are not obvious to an expert in the field.
The number of patent applications is often used as an indicator of successful research and development results. Although it is an indirect indicator it exhibits a good predictive capacity with regard to output of research and development, in particular applied research. The above restriction imposed in the predictive value ensues from the fact that research and development is often separated from the "patenting" procedure institutionally, organisationally and financially. Motivation of participants in R&D and of people who file patent applications may and often does differ. Moreover, legal protection is of little interest to some originators of new knowledge and may be too demanding financially or administratively to others.
Published patent applications and description of granted patents represent an important source of information about technical solutions to problems and the topical state of technology. Patent information is a rich source of ideas and is systematically used in development of new products.
Analytical materials dealing with R&D often state for individual countries or associations of countries the numbers of applications filed by subjects resident in the given country/association and, on the other hand, by non-residents. To facilitate comparison data are often presented relative to the number of inhabitants or the workforce, sometimes also the number of persons involved in R&D. Some derived indicators like the rate of diffusion, the autosufficiency ratio, etc. are often of considerable interest. Numbers of patent applications are often compared in classification by sector as individual sectors differ in the demands they impose on research and development. Analytical materials often contain data about numbers of applications filed with major patent offices such as those in the USA, Japan or the European Patent Office. These data however do not provide relevant information about small countries, even those with highly developed technology, and are usually very small - below one per cent.
Patent protection is granted territorially - by granting a patent the office provides protection only in the relevant country. To obtain protection elsewhere the application must be filed in the country in question. Progress in international manufacturing and commercial cooperation accelerated and simplified the patent application procedure. The Patent Cooperation Treaty (PCT) whose parties now comprise one hundred countries including since 1993 the Czech Republic enables one to indicate in an international patent application other countries in which protection is sought. Other, regional treaties already in effect enable protection to be provided by one patent in several countries. The most widely known is the European Patent Convention.
Details and definitions of specific indicators are given at individual tables and graphs. Data were obtained from materials made available by the Industrial Property Office and from OECD almanacs, primarily from Main Science and Technology Indicators - 1998/2. Data obtained from the two sources sometimes differ owing to differ-ences in the systems and purposes of data acquisition.
Japan is not included among the countries analysed in this part since the Japanese patent system is materially different and, accordingly, the results are not compatible. The high number of patent applications filed in Japan can be explained, in addition to the undoubtedly high level of research and development, also by traditional approaches to industrial ownership protection. Minor technical solutions (no longer legally substantiated) are still filed as patent applications. Comprehensive applications containing several claims, so common in Europe, are an exception rather than the rule. Attempts to develop the original idea through a number of minor innovations are commonplace. The attitude of the Japanese patent office is also more benevolent.
As all legislation of the Czech Republic in the area of industrial rights has been completely overhauled since 1990 and an EU screening effected in 1998 confirmed a high level of preparedness to accession, future efforts aimed on improving the existing state should focus on strengthening patent-oriented activities in the Czech Republic. Compared with foreign countries the Czech Republic still fails to stress orientation of R&D towards inventions and patents and lacks a system of consultants that might provide support to interested parties, primarily small and medium-sized enterprises.
F. ANALYSIS OF APPLIED R&D RESULTS
F1. Applied R&D project completed between 1994 and 1997
(numbers of projects and encompassing programmes)
|
1994 |
1995 |
1996 |
1997 |
Total |
Ministry of Defence
- number of completed projects
- number of programmes
|
13
3 |
38
5 |
58
7 |
22
6 |
131 |
Ministry of Industry and Trade
- number of completed projects
- number of programmes
|
80
4 |
39
5 |
72
7 |
83
8 |
274 |
Ministry of Agriculture
- number of completed projects
- number of programmes
|
63
1 |
215
1 |
42
2 |
75
3 |
395 |
Ministry of Environment
- number of completed projects
- number of programmes
|
35
4 |
25
3 |
15
4 |
7
4 |
82 |
SUM TOTAL
- number of completed projects
|
191 |
317 |
187 |
187 |
882 |
| Source: |
Materials prepared by the relevant ministries in an agreed-upon format |
| Note: |
"Number of programmes" indicates the number of programmes (or systems of project support) within which the relevant projects were completed. |
Commentary
- The analysis dealt with R&D programmes of those resorts where support focuses on practical utilisation of the obtained results. For internal reasons the Ministry of Health did not submit the requested material in time.
- Information was received about more than eight hundred completed R&D projects. The proportion of individual resorts in the overall number of completed projects is essentially in line with the proportion of projects and their R&D expenditures. The time series is not relevant for the objectives of the analysis.
- The Ministry of Defence supports R&D within eight programmes. Most completed projects belong to Programme 3 - Improving health services provided to the military (42 projects) and Programme 1 - Preparation, build-up, procurement and deployment of the Czech Armed Forces (37). No programme has been completed yet within Programme 8 - Research technology and tools.
- Among research programmes and supporting activities of the Ministry of Industry and Trade the following were included in the analysis: completed pro-jects from previous programmes sponsored by the now defunct Ministry of Economy (47 projects) and 8 additional programmes. Most completed projects belong to the group of extraneous programmes dealing with development of scientific and technology innovations (94), the TECHNOS programme oriented towards solution of technological problems and technical innovation (50), and the programme devoted to progressive technologies earmarked for small and medium-sized firms (48).
- Projects sponsored by the internal grant agency represent a substantial part of completed R&D projects administered by the Ministry of Agriculture (383 projects). The analysis also dealt with 7 completed project from the Programme of commercially applicable research, and 5 projects from the Programme of non-private research.
- The Ministry of Environment supports R&D within eight programmes. Most completed R&D projects belong to the programme devoted to care of the environment.
F2. Projected utilisation of results of applied R&D projects completed between 1994 and 1997
(number of instances of expected utilisation of project results)
|
MO |
MPO |
MZe |
MŽP |
Total |
| All completed projects |
131 |
274 |
395 |
82 |
882 |
| Projected methods of utilisation |
| New knowledge without specific concept of utilisation |
0 |
1 |
27 |
0 |
28 |
| New products |
8 |
99 |
41 |
0 |
148 |
| New procedures, technologies etc. |
66 |
108 |
315 |
37 |
526 |
| Regulations, standards |
12 |
14 |
15 |
28 |
69 |
| Organisational changes |
4 |
1 |
3 |
2 |
10 |
| Other |
41 |
79 |
25 |
39 |
184 |
| Source: |
Materials prepared by the relevant ministries in an agreed-upon format |
| Note: |
More than one mode of utilisation of results may be envisaged for a completed pro-ject. The sum of utilisation methods may thus exceed the number of completed pro-jects.
MO - Ministry of Defence;
MPO - Ministry of Industry and Trade;
MZe - Ministry of Agriculture;
MŽP - Ministry of Environment |
Commentary
- It follows from the summary data for the analysed resorts that a majority of projects (more than 50 %) envisage utilisation in the form of new procedures and new products.
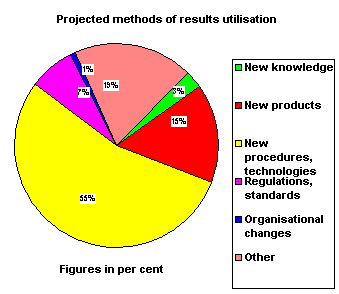
- Utilisation of results within the Ministry of Defence concentrates in a group of procedures and technologies according to requirements imposed by potential users; about one half of them concerns health care. A major proportion of methods of utilisation are classified among "Other", primarily in areas like education, carrying out operations, combat.
- Within the Ministry of Industry and Trade the projected utilisation of R&D results falls mostly to the class New technologies and products, in part to the class Regulations and standards. "Other" include primarily utilisation of results by scientific and technical information centres.
- Within the Ministry of Agriculture utilisation of R&D results is envisaged mostly for new technologies, procedures, and innovations. In view of the structure and number of potential users in agriculture, new procedures and technologies are disseminated in the form of recommendations and methodologies through training and consulting. The class "Other" includes primarily results whose utilisation will require additional research and development including checking.
- Within the Ministry of Environment results are to be utilised in new technologies and procedures; a major part classified as Other refers to decision-making processes inside the Ministry.
F3. Actual utilisation of results of applied R&D projects completed between 1994 and 1997
(number of instances of actual utilisation of project results)
|
MO |
MPO |
MZe |
MŽP |
Total |
| All completed projects |
131 |
274 |
395 |
82 |
882 |
| Actual methods of utilisation |
| No utilisation yet |
10 |
11 |
- |
0 |
21 |
| New products |
7/8 |
87/99 |
41/41 |
0/0 |
135 |
| New procedures, technologies etc. |
64/66 |
108/108 |
310/315 |
33/37 |
515 |
| Regulations, standards |
10/12 |
14/14 |
15/15 |
28/28 |
67 |
| Organisational changes |
4/4 |
0/1 |
3/3 |
2/2 |
9 |
| Other |
36/41 |
78/79 |
25/25 |
38/39 |
177 |
| Source: |
Materials prepared by the relevant ministries in an agreed-upon format |
| Note: |
More than one mode of utilisation of results may be envisaged for a completed project. The sum of utilisation methods may thus exceed the number of completed projects. MO - Ministry of Defence; MPO - Ministry of Industry and Trade; MZe - Ministry of Agriculture; MŽP - Ministry of Environment |
Commentary
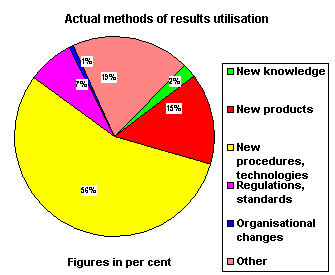 The differences between actual and projected utilisation of results are suprisingly small. The largest difference - some 10 % - is in the class New products. Results of 21 projects - less than 3 % of the sum total of 82 projects - have found no use yet. Differences between expected and actual rate of utilisation of results of state-subsidised R&D are much higher abroad. US and Japanese materials indicate differences in excess of 15 % for research directed towards utilisation in new products, technologies and services. The EU and a number of European countries report that Europe considerably lags behind the USA and Japan in practical realisation of R&D results, its speed and effectiveness.
- In case of the Ministry of Defence the small differences between actual and projected utilisation can be attributed to the specific character of defence-oriented research, more closely related to requirements of users than is the case in civil R&D.
- In case of the Ministry of Industry and Trade results of 263 projects (out of the total number of 274 completed) were actually utilised. Except in the class New products the differences are insignificant.
- In establishing the difference between projected and actual results for the Min-istry of Agriculture there is a methodical rub consisting in the large number and considerable fragmentation of potential users. The class Other contains primar-ily those completed projects whose results are being further developed by ongo-ing research and development. To a certain extent these projects bear the char-acter of basic research.
- The same holds true of the Ministry of Environment Protection where however a moderate difference between actual and projected utilisation exists only in the class New procedures and technologies.
F4. Reasons underlying the difference between projected and actual utilisation of applied R&D projects completed between 1994 and 1997
(numbers of instances where there is a difference between projected and actual utilisation of project results)
|
MO |
MPO |
MZe |
MŽP |
Total |
| All completed projects |
131 |
274 |
395 |
82 |
882 |
| Reasons underlying difference in utilisation |
| Projected results not attained |
3 |
2 |
5 |
1 |
11 |
| Lack of interest in utilisation |
0 |
11 |
- |
0 |
11 |
| Lack of funds on the part of user |
1 |
2 |
- |
1 |
4 |
| Other solution of problems identified |
1 |
1 |
- |
0 |
2 |
| Other |
5 |
1 |
- |
3 |
9 |
| Total |
10 |
17 |
5 |
5 |
37 |
| Source: |
Materials prepared by the relevant ministries in an agreed-upon format |
| Note: |
MO - Ministry of Defence;
MPO - Ministry of Industry and Trade;
MZe - Ministry of Agriculture;
MŽP - Ministry of Environment |
Commentary
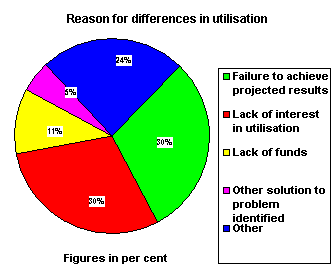 The most often reported reason for the difference in the projected and actual utilisation of completed projects is lack of interest on the part of potential users owing to organisational or ownership changes, restructuring etc. A failure to achieve the expected results is another, equally frequent reason - both are reported as major reasons also in foreign analyses, where however it is often stated that competitors identified and implemented other, more effective solutions than those contained in the output of the R&D project involved.
- In a detailed explanation of reasons underlying failure to achieve the projected results, the Ministry of Defence states cancellation of the principal investigator's position without replacement and departure of key specialists.
- The Ministry of Industry and Trade specifies among the underlying reasons the necessity of additional pilot-plant and operating tests due to a change in ownership of the subject expected to implement the results.
F5. Utilisation of results of completed projects - commentary
All OECD countries strive to increase efficiency of transforming the R&D results into new products, technologies and services. In R&D supported from public funds the investigator is often separated - organisationally, geographically and temporarily - from the final user of the R&D results. Transfer of R&D results to small and medium-sized firms that usually do not have their own R&D capacities poses a specific problem.
Measures assisted from public funds are implemented aimed at improving transfer of R&D results (subsidised consultation services, scientific and technological parks, incubators, centres of excellence with participation of users, mobility of the workforce, etc.). European countries and the EU reached the conclusion that in transfer of R&D results Europe significantly lags behind the USA and Japan. It follows from available materials that in the USA and Japan more than 15 % of obtained results are not utilised within a reasonable time - three years after completion - or the projected results are not achieved at all.
Thus, analyses of EU programmes (the BRITE programmes were repeatedly analysed in considerable detail) resulted in mandatory proposals concerning utilisation of obtained results. The holder of a R&D project prepares proposals and negotiates them with potential users. An extensive examination of economic benefits brought about by practically implemented R&D results is currently in progress in the EU. In the EUREKA programme the principal investigator of a research project must submit a Final Report containing the expected utilisation of results. For projects with expected com-mercial utilisation the principal investigator must submit additional Market Impact Reports (MIR) after 1, 3, and 5 years after project completion. Results of analyses are used to improve the procedure of R&D programme and project preparation and management as well as to detail and coordinate measures undertaken in support of transfer of results.
It was assumed during preparation of draft contents and procedure of national policies that the situation in the Czech Republic will be comparable with, if not worse than, that prevailing in EU member states. It was decided to assess, as part of an analysis of the state of R&D in the Czech Republic and its comparison with the situation abroad, inter alia utilisation of results of projects completed between 1994 and 1997. At the meetings of the analytical group a synopsis of an analysis of completed projects was agreed; analytical materials should be prepared and submitted by the ministries that subsidise from their respective budgets research and development whose results might be immediately utilised in practice (applied R&D). Thus, the analysis is not expected to deal with projects that bear the character of basic research (solved in the Academy and at universities), nor with projects supported by the Czech Grant Agency. The following ministries were asked to prepare the relevant materials in an agreed-upon form: Ministry of Defence, Ministry of Industry and Trade, Ministry of Agriculture, and Ministry of Environment. The Ministry of Health promised to try to prepare the material despite the fact that most projects it administers bear the character of basic research. The above ministries indeed prepared the requested materials in the agreed-upon format. The Ministry of Education, Youth and Sport submitted a material dealing with the international programme EUREKA. Three projects with Czech participation devoted to new technologies were completed within the examined period. The Ministry of Health failed to submit the material owing to the small number of applied R&D projects.
The results are surprising and indicate that the situation in utilisation of completed projects in not only more favourable than in the EU member states but more favourable than that in the USA and Japan. This state of affairs is in all probability imaginary, as evidenced, inter alia, by the fact that the number of patent applications per 10,000 inhabitants, filed by subjects resident in the Czech Republic, is substantially smaller than similar numbers reported by developed countries. Another supporting evidence is the markedly lower productivity and competitiveness of the Czech industry.
The surprising results cannot be attributed to errors in data processing. The main reason is apparently vague or less demanding objectives set forth in R&D projects. It is then easy to achieve results or demonstrate that results have been achieved. Another reason might be vague ideas concerning utilisation of results and the ensuing necessity to settle for partial or insufficient utilisation.
A working committee established for preparing the chapter "Research, Development and Transfer of Results" of the national R&D policy, primarily by the subcommittee for industrial research will deal with the problem.
G. ECONOMIC PERFORMANCE AND R&D
G1. Gross domestic product per head between 1993 and 1996
(GDP per head expressed in ECU at purchasing power parity)
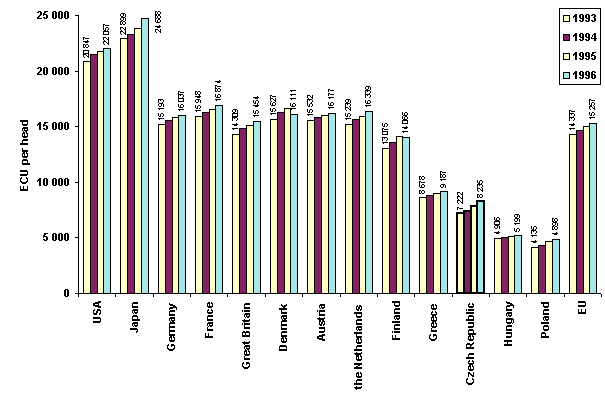
Source: Eurostat, Second European Report S&T Indicators
Commentary
- Economic performance of a country as measured by gross domestic product per head (GDP/head) and other indicators is undoubtedly affected by R&D. How-ever, research and development influence these indicators only indirectly. Inter-posed between R&D results and the aggregate indicators are processes involved in transfer of R&D results, mostly demanding on time, funds and organisation, and accompanied with construction, marketing, trade, and services provided to distributors, customers, etc. Persons and organisations involved in R&D usually no longer participate in these processes. The relationship between R&D and economic level is complex. Nevertheless, based on long-term experience with practical policies investments in R&D are considered in standard econo-mies to be pro-growth expenditures and rank among factors promoting pro-ductivity of both labour and capital. A similar situation prevails in pro-growth investments in education.
- Economic performance of the Czech Republic measured by GDP/head is con-siderably smaller than that existing in the EU. In 1997 the Czech Republic attained 64 % of the EU mean value, but exceeded that of other candidate countries.
- The following Table has been taken over from Eurostat No. 2/1999 of 10 March. The data confirm the implications contained in paragraph 2 of the Commentary.
Relative level of GDP/head in 1997
(expressed in per cent of the mean EU level = 100 %)
|
Slovenia |
Czech Republic |
Hungary |
Poland |
Estonia |
| Relative HD/head (%) |
68 |
64 |
49 |
37 |
37 |
- Economic performance of the Czech Republic grows more slowly than that of the remaining candidate countries. Poland and Hungary exhibit the most rapid growth as demonstrated by a Table taken from Eurostat 1999.
GDP increments (%) on the year earlier, EU candidate countries, 1993 - 97
(in per cent, current prices)
| Country |
1993 |
1994 |
1995 |
1996 |
1997 |
| Czech Republic |
0.7 |
5.9 |
5.8 |
2.2 |
2.5 |
| Hungary |
-0.6 |
2.9 |
1.5 |
1.3 |
4.6 |
| Poland |
3.8 |
5.2 |
7.0 |
6.1 |
6.9 |
| Estonia |
-0.6 |
2.9 |
1.5 |
1.3 |
4.6 |
| Slovenia |
2.8 |
5.3 |
4.1 |
3.3 |
3.8 |
G2. Trend of labour productivity, 1994 - 96
(mean annual change in labour productivity in per cent, 1994 to 1996)
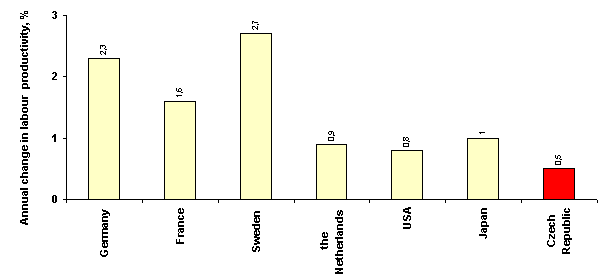
| Source: |
OECD, DSTI/IND/STP/ICP(97) |
| Note: |
Productivity of labour measured by GDP per employee. |
Commentary
- The increments of labour productivity in the Czech Republic are significantly smaller than the EU average but higher than in most other candidate countries
- Prerequisite for more rapid growth of labour productivity and competitiveness in the Czech Republic is an expeditious transformation of industrial sectors and segments of advanced services to achieve higher added value, i.e., a transformation to industries in which it is effective and efficient to utilise results of R&D.
G3. Foreign trade - export of manufactures and service - 1980 and 1997
(comparison of exports in 1980 and 1997 in per cent of gross domestic product)
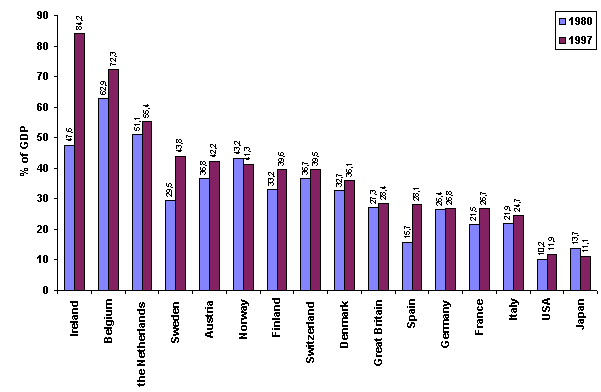
Source: OECD
Commentary
- Success of research and development is in many foreign analytical materials assessed on the basis of foreign trade in sectors and segments that impose high demands on R&D. This is particularly true of small ad medium-sized countries with insufficient raw material base that must base their economic and social development on export.
- Smaller and rapidly growing countries (Ireland, The Netherlands, Finland, etc.) create a substantial part of GDP by exports. The proportion of exports in GDP creation is considerably smaller in large countries with an extensive domestic market.
- Data for the Czech Republic are available in almanacs published by the Czech Bureau of Statistics, but their comparison is very difficult for many reasons. The following figures have been derived from the CBS data: proportion of export in GDP: 31.6 % in 1980 and 38.9 % in 1997. At first sight these figures are acceptable. The structure of exports is unsatisfactory, though: products with low added value prevail and also the proportion of raw materials is still exces-sive, but a favourable trend can be discerned in export of machinery and equip-ment.
- In most countries the proportion of export in GDP creation increased between 1980 and 1997, apparently owing to the fact that during the last twenty years the volume of foreign trade grew much more rapidly than the volume of production.
G4. Foreign trade - import and export of hi-tech products, 1993 - 1995
(data for 1993, 1994 and 1995 in ECU million)
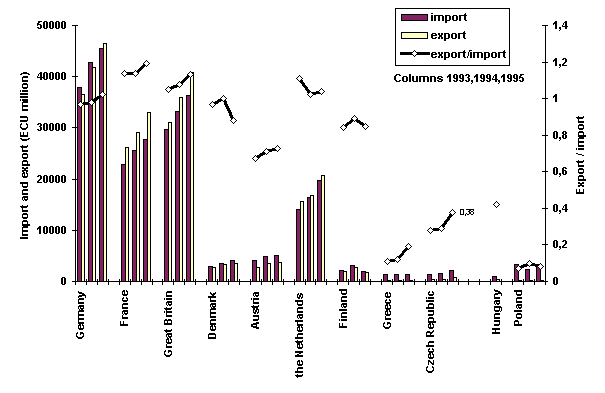
Source: Eurostat, Second European Report S&T Indicators
Commentary
- Periodic OECD materials devoted to research and development indicators, "Main Science and Technology Indicators", contain data on the balance of trade in licences and the proportion of export and import for 4 sectors (areas) from the hi-tech category (aerospace, computers and office technology, electronics, pharmacology).
- Data about export and import of high-tech products (as defined by OECD) and their share in overall export/import are regularly published by the Ministry of Industry and Trade in its periodic analyses. The following Table has been taken over from these materials.
G4.1 Import and export of hi-tech products - Czech Republic
(data in per cent of overall import/export volume, CZK billion, current prices)
|
1995 |
1996 |
1997 |
1998 |
Import
- in % of overall volume of import
- in CZK billion
|
12.07
66.88 |
11.4
85.78 |
11.1
95.88 |
12.0
111.96 |
Export
- in % of overall volume of import
- in CZK billion
|
4.44
20.12 |
6.66
39.6 |
7.2
51.8 |
7.4
63.2 |
| Export/import |
0.30 |
0.46 |
0.54 |
0.56 |
Source: Ministry of Industry and Trade - analytical department
- The proportion of export of hi-tech products is substantially smaller in the Czech Republic than in the developed OECD countries; its rapid growth (in CZK billion) is however a promising feature: between 1995 and 1997 the export of hi-tech products grew more than three times.
- Despite a certain growth in overall volume the data indicate a stagnating proportion of import/export of hi-tech products. Another factor is the time lag in the effect of insufficient new solutions archived in industrial R&D, brought about by the slump during the transformation period in the first half of the 1990s. Computer technology, aviation engineering and electrical engineering products experienced the most rapid growth among hi-tech products exported in 1998.
- The 1995 data promulgated by the Czech Bureau of Statistics show a higher proportion of export compared with the MPO data but the difference is insignificant.
G5. Expenditures of manufacturers on R&D in 1997
(R&D expenditures in per cent of revenues)
Sector
enterprise |
R&D expenditures
(in % of revenues) |
Sector
enterprise |
R&D expenditures
(in % of revenues) |
| Chemistry |
Mechanical engineering |
| Du Pont, USA |
5.8 |
ASEA BB, Switzerland |
8.5 |
| Hoechst, Germany |
7.7 |
Boeing, USA |
4.2 |
| BASF, Germany |
9.5 |
Mitsubishi, Japan |
3.8 |
| Dow Chemical, USA |
3.9 |
Lockheed, USA |
2.8 |
| Boehringer, Germany |
18.4 |
Mannesmann, Germany |
2.6 |
| Henkel, Germany |
2.3 |
Sulzer, Switzerland |
4.0 |
| Ciba, Switzerland |
3.9 |
British Aerospace |
2.6 |
| Electronics, electrical engineering |
Sandvik, Sweden |
2.9 |
| Siemens, Germany |
7.6 |
Motor vehicles |
| IBM, USA |
5.5 |
General Motors, USA |
4.9 |
| Hitachi, Japan |
5.9 |
Ford Motor, USA |
4.1 |
| Ericsson, Sweden |
14.5 |
Toyota, Japan |
3.7 |
| Motorola, USA |
9.2 |
Volkswagen, Germany |
3.9 |
| Toshiba, Japan |
9.4 |
Renault, France |
4.3 |
| Sony, Japan |
5.2 |
Fiat, Italy |
2.8 |
| Xerox, USA |
5.8 |
MAN, Germany |
2.7 |
| Pharmacology |
Volvo, Sweden |
4.7 |
| Roche, Switzerland |
15.5 |
Telecommunications |
| Pfizer, USA |
15.8 |
Alcatel Alsthom, France |
6.8 |
| Merck, USA |
7.1 |
France Telecom, France |
6.8 |
| Schering, Germany |
17.8 |
NTT, Japan |
3.7 |
| Genentech, USA |
42.5 |
Deutsche Telecom, Germany |
1.8 |
| Services |
|
|
| Microsoft, USA |
16.9 |
|
|
| Oracle, USA |
9.8 |
|
|
| Platinum Technology, USA |
63.6 |
|
|
| Novell, USA |
28.1 |
|
|
Source: The UK R&D Scoreboard 1998 - Company Reporting, Ministry of Trade and Industry
Commentary
- Analyses devoted to performance of individual companies contain very interesting data. Characteristics of research and development are usually stated as per cent of overall revenues. In 1996 and again in 1998 the Confederation of Industry of the Czech Republic organised extensive questionnaire surveys of innovation activities of its members. Although individual data are not available, the summary states that a substantial part of companies invest in research and development less than 2 % of their respective revenues, and expect the figure to grow to 2.2 % by 2000. R&D expenditures in the Czech Republic are generally considered to be low and should be raised. The situation is more complicated, however. Materials published abroad indicate that increasing expenditures are not an end in itself and must be preceded with an extensive reconstruction of the industrial base.
- In 1998 the UK Ministry of Trade and Industry published a summary of R&D expenditures for five hundred major global firms (The UK R&D Scoreboard 1998 - Company Reporting). This material was the source of data referring to R&D expenditures in 1997 of some selected major companies from different manufacturing and services sectors.
- Pharmaceutical companies as well as firms that provide corporate services report high R&D expenditures. This group also includes top software compa-nies.
- Engineering firms including car manufacturers spend some 4 % of their reve-nues on research and development. In sectors characterised by lesser demands on research and development growth of productivity and competitiveness is achieved primarily by investments in machinery and equipment, changes in organisation and management as well as marketing and development of services provided to customers.
- Most Czech firms in the industry and services operate in sectors less demand-ing on research and development. Increasing R&D expenditures in itself would hardly bring any desirable effect unless accompanied or preceded by invest-ments aimed at rapid and substantial restructuring.
- During the transformation period the rate of investment was relatively high in the Czech Republic, but high investments were not reflected in a growth of the economy and productivity. The Report on the State of the Czech Society and other analytical materials state that investments were directed primarily to transport, telecommunications, and power generation infrastructure and also to financial institutions (banks, insurers, savings banks, etc.). Investments in the processing industry amounted to about 20 per cent of the sum total invested, and a substantial part of these relatively small investments went to computers, vehicle fleets, etc.
G6. "Hi-tech" - methodological supplement
High-tech is not a mere buzzword in today's' marketing and promotion. In the second half of the 1980s OECD bodies initiated a number of studies assessing from various points of view the demand that individual industrial sectors impose on research and development. Demand was evaluated according to three indicators: the proportion of R&D expenditures in the overall revenues of each sector; the proportion of R&D expenditures in value added by each sector; and the sum of R&D expenditures and expenditures connected with purchase of the necessary technologies divided into the revenues of each sector. The years 1980, 1985 and 1990 and various countries were analysed. On the basis of the obtained results sectors were divided into four groups differing in the "demand" imposed on research and development:
- high-tech sectors
- medium-tech sectors
- medium-low-tech sectors
- low-tech sectors.
To simplify somewhat one may state that high-tech sectors spend more than 8 % of revenues on research and development, medium-high-tech sectors spend between 4 and 8 %, etc.
Detailed reviews have been compiled attributing to the above four groups manu-facturing sectors according to the ISIC classification (International Standard Industrial Classification), as subsequently amended. Tables have been also compiled that enable conversion to the NACE classification (General Industrial Classification of Economic Activities) employed in the EC. The classification of sectors was subsequently sup-plemented with classification of products based on the Standard International Trade Classification (SITC).
With an acceptable degree of simplification materials published abroad classify the following eight industrial sectors as high-tech:
- manufacture and repair of aircraft and satellites
- computers and office technology
- electronics (without computers and office technology)
- pharmaceuticals
- scientific instruments
- chemicals
- motor vehicles
- electrical engineering
The first four groups rank among high-tech industries, the remaining four among medium-high-tech industries.
The Ministry of Industry and Trade in co-operation with the Czech Bureau of Statistics uses the high-tech group as defined above to analyse foreign trade.
The high-tech category (including the high-tech and the medium-high-tech classes) is used in assessment of investments, foreign trade, labour productivity, employment, etc. in individual sectors. Data for the countries analysed in this part of the report and for the Czech Republic are not available.
Notes:
- More accurately, an analysis of patent applications as a part of industrial protection of research and development results.
- The abbreviation "R&D" is used to designate research and development in the figures and tables. In the text and figures the term "private" is used to describe R&D not supported by the State, i. e. "private", "business", "corporate".
- The Czech Government in its Resolution No. 249 of 22 March 1999 undertook to raise state expenditures on R&D to 0.6 % of GDP in 2000, to 0.65 % in 2001 and to 0.7 % of GDP in 2002.